Last November, the global market value of crypto assets amounted to $3.2 trillion (FT Wilshire Digital Asset Index). Today, it is something less than $ 861 billion. In other words, the 73% loss in the crypto and NFT (non-fungible token) space in one-year is, so far, nearing $3 trillion and about 38% of the $8 trillion in stock market losses incurred during the 2007-09 financial implosion. The ripple effects of this speculative boondoggle are just getting started as contagion spreads among novice and so-called sophisticated investors alike.
A few weeks back CNN interviewer asked crypto-trading site FTX founder Sam Bankman-Fried (SBF) how common Ponzi schemes were in crypto, and his answer is iconic of the era that was. Here is a direct video link.
Forbes, the paid-to-promote-financial media conglomerate that repeatedly featured SBF as a billionaire wunderkind, is now asking Where did the money go?
FTX bankruptcy filings released Thursday revealed that FTX founder Sam Bankman- Fried, his cofounder Gary Wang and two other executives received a total of $4.1 billion in loans from his Alameda Research trading firm.
Of that total, $1 billion went to Bankman-Fried in the form of a personal loan, while $2.3 billion went to an entity he controls, Paper Bird (Bankman-Fried has told Forbes that he owns 75% of the entity, with Wang owning the rest)—so that’s another nearly $1.73 billion at Bankman-Fried’s disposal. FTX’s Director of Engineering Nishad Singh got his own loan of $543 million, while Ryan Salame, the co-CEO of FTX’s Digital Markets \subsidiary, received a $55 million personal loan.
“The obvious question: Where did all that money go? There are two principal areas we know about so far: political donations and personal investments.”
“Personal investments.” Sure; like a reported $648 million in trading app Robin Hood (-78%) since July 2021, more than $500 million quid pro quo in venture capital firms like FTX’s biggest backer Sequoia Capital, along with a few other gambling fronts like Multicoin Capital.
When financial bubbles burst, it is common for people to ask where did the money go? Much of it is vaporized as market values typically fall by more than 70 percent. But, it’s important to understand that it is not just scam companies and Ponzi schemes that tumble as forced selling and panic spreads.
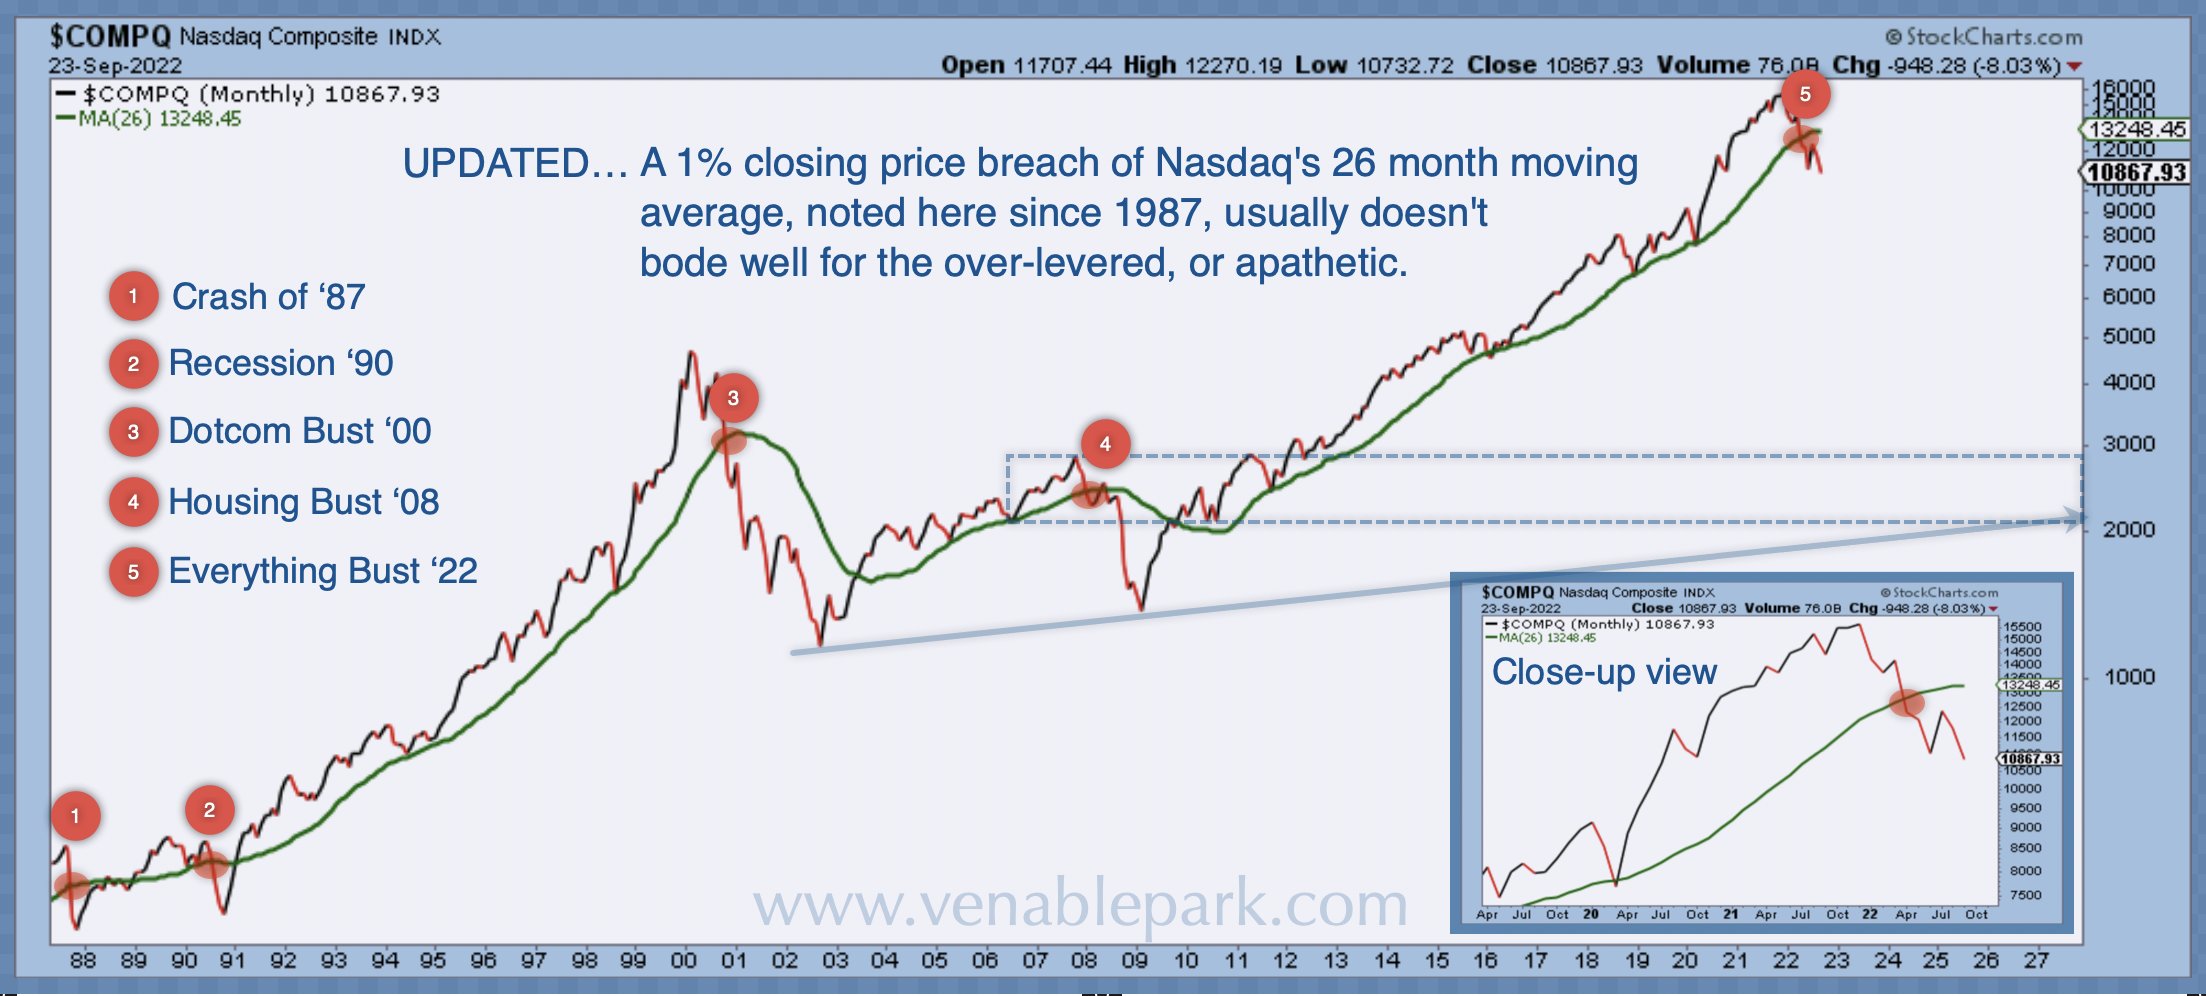
As shown below, since 1987, courtesy of my partner Cory Venable, the Nasdaq composite index–a basket that includes some of the most successful, world-changing companies of the past twenty years–fell 77% after the last tech bubble burst January 2000 to October 2002 and 53% during the bear market of 2007-2009. After closing in April below its 26-month moving average for only the fifth time since 1987, the Nasdaq’s 30% decline thus far is tiny in terms of the extremity of the latest everything bubble. From 11,000 today, long-term support lies somewhere in the 3000 range- 70% lower and 80% beneath the bubble peak last fall.
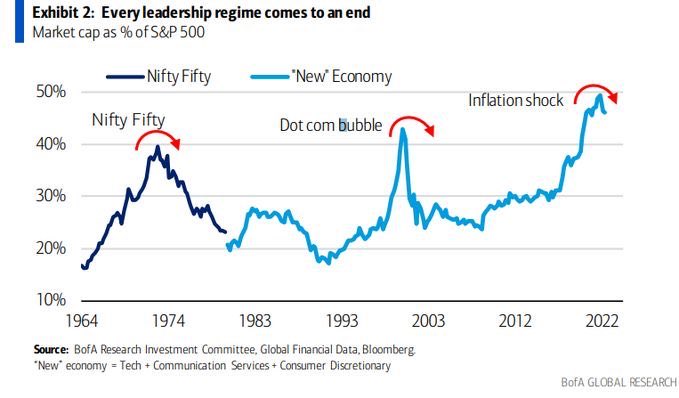
As shown below courtesy of Bank of America, whether it be the Nifty Fifty stocks in the 1960s or tech stocks in 2000, whenever “new economy” companies are bid up to more than 40% of the S&P 500’s overall market capitalization, as they remain today, prices have collapsed back to less than 25%. As in the 2000-02 bust, mean reversion this cycle will have particularly far-reaching impacts because the tech sector was so widely loved and over-concentrated in individual and institutional portfolios and funds, far and wide.


