Oil sector misleading investors on future growth forecasts

A new report Forecasting Failure: why investors should treat oil company forecasts with caution, looks at the way in which flawed forecasts from oil companies continue to mislead investors on future growth prospects.

Charlie Kronick is the Senior Programme Advisor for Greenpeace in the UK and the Global lead on finance and investment for the oil industry, he has focused for most of the last decade on energy and climate change related issues; and on the risks to capital markets from investment in high carbon infrastructure.  Here is a direct video link to part 1.

Here is part 2.

Here is a slide summary of the report:
Posted in Main Page | Comments Off on Oil sector misleading investors on future growth forecasts

Globalization now in third secular retreat since late 1800

A good historical overview of the retreat in globalization now sweeping the world can be found in  Whatever Happened to Free Trade?

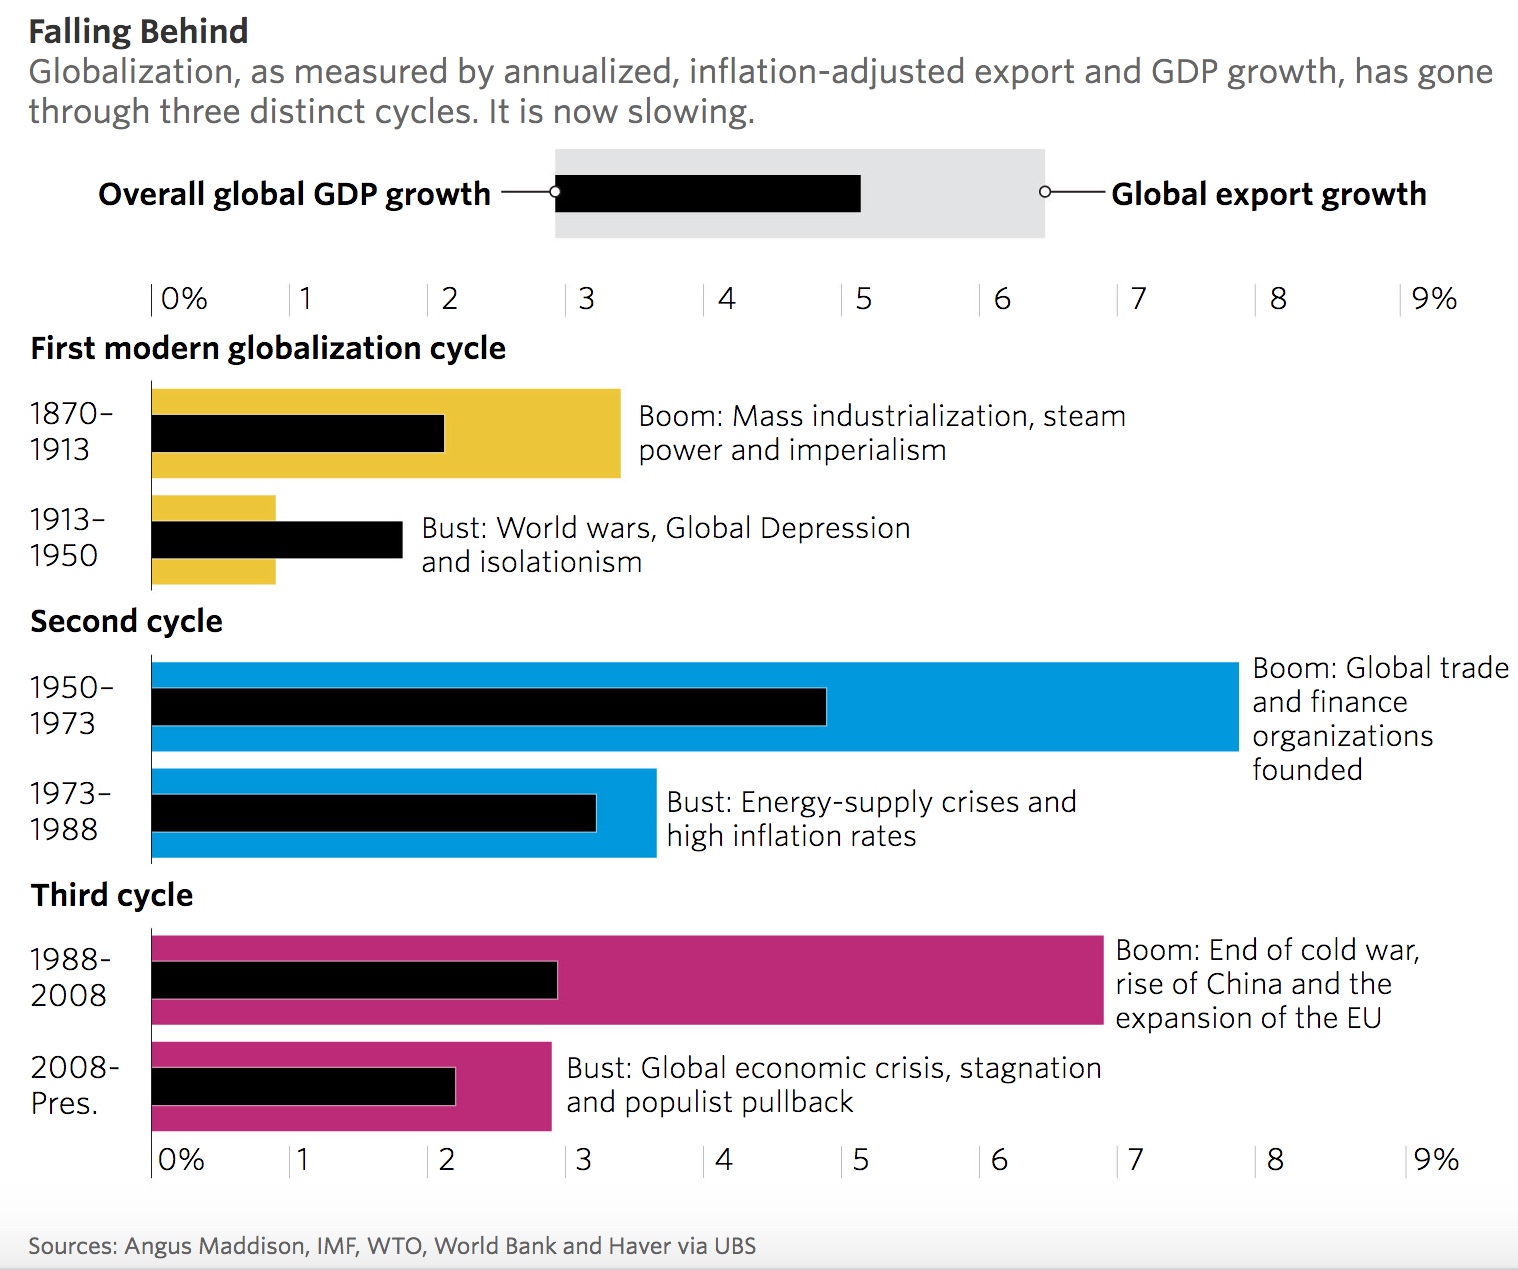
Globalization is a secular cycle, now in its third mean reversion since the late 1800’s as charted below.

The first expansion cycle lasted 43 years and then spent 37 years in the retracement phase (1913-1950). The second expansion lasted 23 years, followed by 15 years (1973 to 1988) of retracement. The third lasted 20 years from 1988-2008 , before beginning the give back period now in process. Now just 9 years in, we should expect this downcycle in global trade, capital flows and growth to continue for several more years, perhaps a decade or more.  This is all par for the historical course.

Trees can’t grow to the sky, hence we need the downturns to reboot and refresh:  to burst asset bubbles, consolidate debt and reallocate capital from speculation to productive investment and policies.

Posted in Main Page | Comments Off on Globalization now in third secular retreat since late 1800

When asset price gains are too much to last

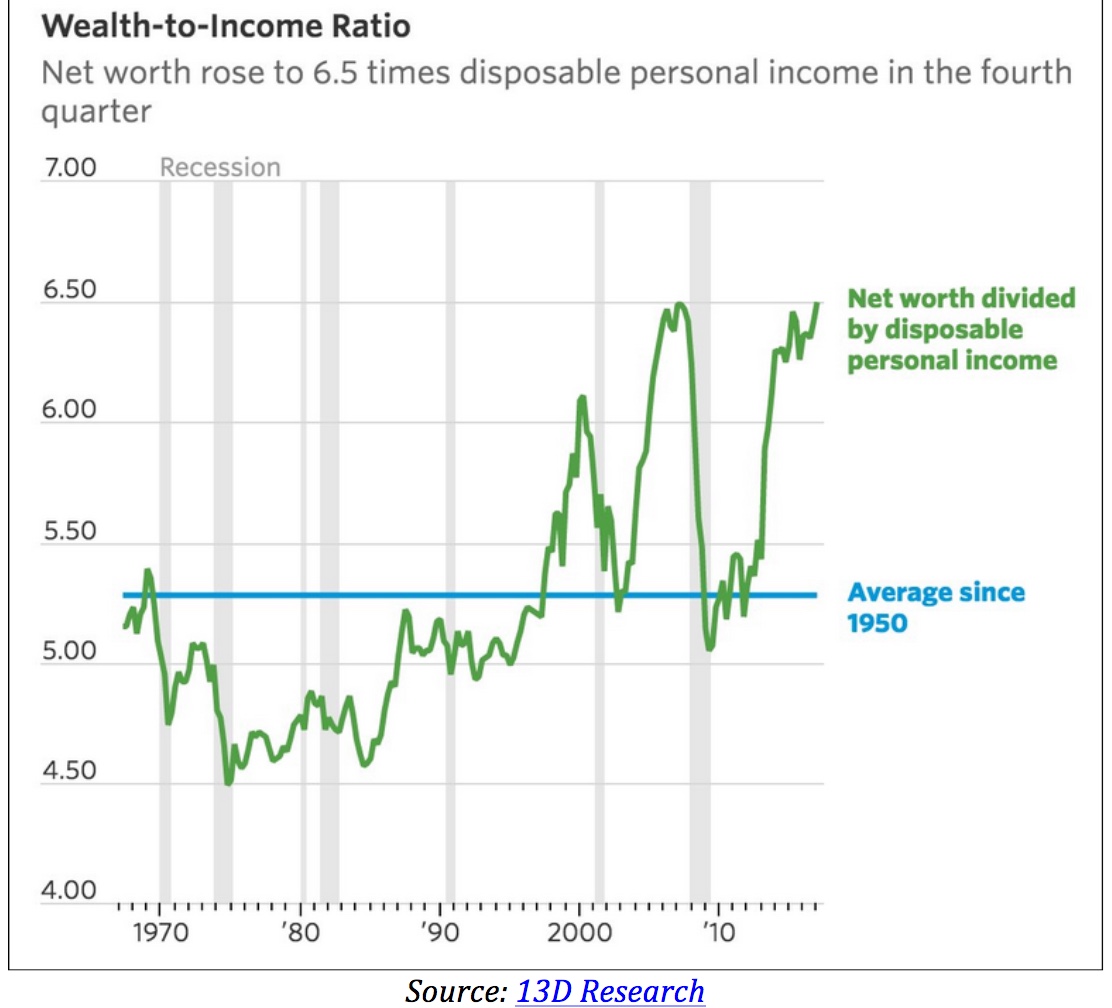
Good perspective on the impact of bubblenomics and asset price gains, relative to income, courtesy of Patrick Watson today in Charts that Matter:

“More net worth is always good, right? Not necessarily. This chart from 13D Research shows US household net worth divided by average disposable personal income over the last 50 years.


If you do everything right and are lucky, your net worth should be greater than your income. But if it is too high relative to your income, it may be unsustainable. Peaks tend to coincide with recessions and bear markets. Today, the ratio is near an all-time high and very close to the last peak just ahead of the 2007–09 recession. That vicious bear market knocked the ratio back down to its long-term average. It has since crept higher again. In fact, much of the net worth was illusory in the first place. Housing accounts for a big part of it, with both banks and homeowners marking property values well above realistic selling prices. It may be happening again.”

It reminded me of this chart of the incredible leap in Canadian and Australian household wealth relative to other countries in 2016, courtesy of bubbling realty prices.  Since few cash out when asset prices are unreasonably high, most will keep holding as their net worth retreats through the mean reversion cycle once more.

Posted in Main Page | Comments Off on When asset price gains are too much to last