The conflicted mess of the ‘investment business’

Enjoying the Globe at our Saturday coffee shop this morning, I came across a little article which sums wonderfully the conflicted mess we call the ‘investment business’ see: Dundee Corp. share exchange under fire.

Evidently fund company Dundee management has come under criticism for solicitation fees it is paying brokers to convince Dundee preferred shareholders not to take cash owed to them on a maturity next summer, but rather to roll over their capital for another 3 years.  Shareholder rights groups and some money managers have called the payments “a huge conflict of interest” and “coercive”.  The article then quotes new Dundee CEO David Goodman with this knee-slapper that nearly caused me to spit out my coffee:

“I have a very high appreciation for the integrity of and value that the financial advisers provide and I don’t believe that the receipt of a solicitation fee for their services is going to compromise their ability to properly advise their clients.

Good one right?

I have not been following Goodman and company or Dundee but the article explains “Dundee is under financial pressure having lost more than $400 million in the year to date, primarily due to heavy exposure to the cratering resource sector.” This reminded me of a panel I did at the Toronto investment conference in September 2013 with then CEO, a supremely confident Goodman senior.  I wrote about it here with a link to the panel video and the following comments:

(All of which reminds me of some embarrassing assertions made by Dundee’s Ned Goodman on an investment panel I did with him in 2013 (clip is here) where he was saying the Fed would never tapper QE in his life time (at 1:30 min) while talking up insatiable Chinese growth and confidently assuring the audience that there were no such thing as Chinese ghost towns (see our exchange starting at 6:58)…hmmmm).

(I’ve done a lot of panels in my time, with a lot of different money managers, but truly this performance was ‘memorable’)

In any event, Goodman and company may be getting what they deserve for being brutally wrong on their analysis but they had already personally cashed out when Scotiabank bought the bulk of their management business for $2.3 billion in 2011 (at $21 a share).

Unfortunately it is retail investors who have once more been hammered in all of this mess.  The chart since 2005 tells the story:  the stock is down more than 53% in the past year and just under 75% since 2013.   Just another tale as old as time in the marketing machine otherwise known as the ‘investment business’.
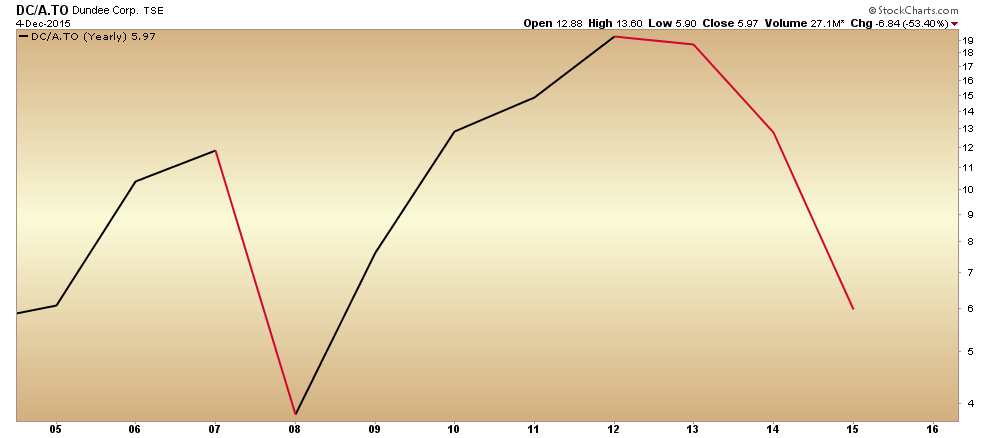
Dundee yearly since 2006

Posted in Main Page | Comments Off on The conflicted mess of the ‘investment business’

Friday funnies

ECB’s Draghi is in full PR mode today explaining why what he said yesterday was actually much more bullish for financial assets than what market participants seemed to think yesterday when they sold with both feet.  The algos have grabbed the headlines and run US stocks up the hysteria pole (S&P 500 and TSX still negative for the week notwithstanding), while oil (just closed the week under $40), corporate bonds (lower), treasuries (higher) Canadian stocks (flat) and the loonie (lower) are all rejecting a jubilant read.

A few charts to help cut through the noise…

First as US stock prices leap this afternoon, the year over year change in earnings per share for the Russell 2000(small-cap in blue) and S&P 500 (large cap in orange) companies has been falling since 2011 and is negative over the past 15 months.

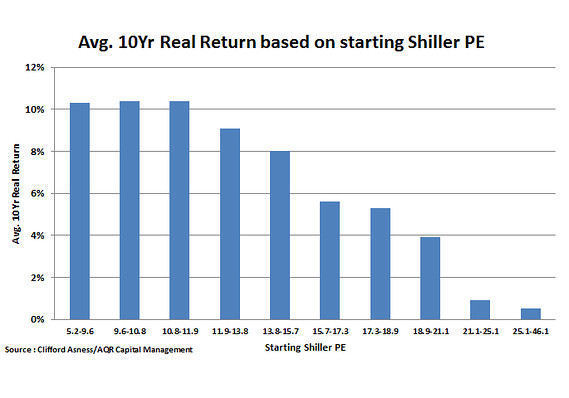
profit s&p vs russellPrices up, earnings way down means the price to earnings ratio for US stocks is at nosebleed highs only bested once in human history at the fleeting tech-wreck peak of 2000. For the S&P 500, the Shiller PE is today an eye-popping 26.39. While the Russell 2000 is trading at a hilarity-inducing 145x earnings! All proof positive that stocks are still stuck within the secular bear that began in 2000. The next, third, and likely to be equally massive (as 2001-03 and 2007-09) cyclical correction is coming folks. Stay-ready.

Missed in all this madness(as graphed in blue), the S&P 500’s PE of 26 (never mind the Russell’s 145) suggests that annual returns will be zero and less for the next 10 years from current price levels (see far right bar below) and this is even if one managed to hold on through a decade of heart-thumping volatility and collect the meager dividends.  Like them apples?  You can have ’em.  Peace out!

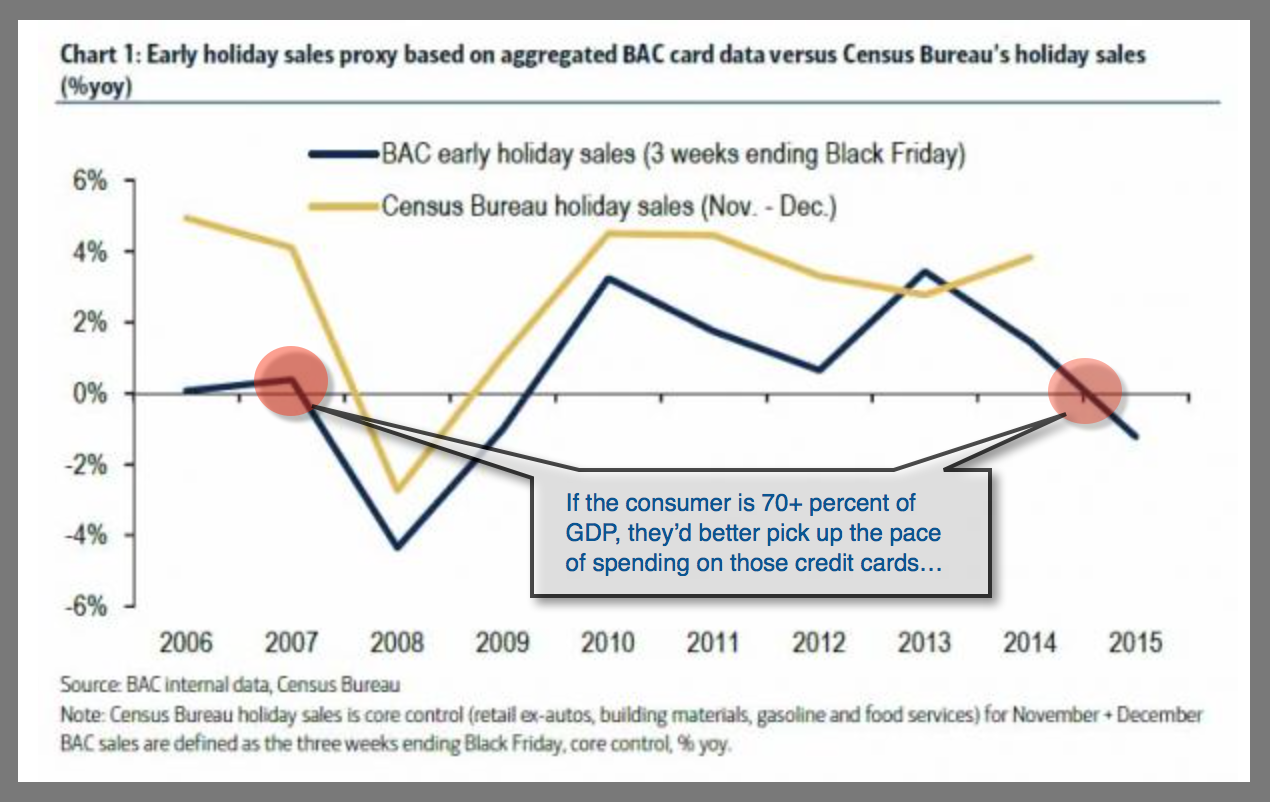
PE and subsequent returnsOne thing is clear from year over year holiday season sales (in blue below). Shoppers don’t seem to be buying Janet Yellen’s ‘all clear on the western front’ spiel.  We haven’t seen them this miserly since the onset of the 2008 recession.   Good, because the best present we can give our families is more savings and less debt.  Pass it on.
BAC credit card use

Posted in Main Page | Comments Off on Friday funnies

Short term gains purchase longer term pain for dividend stocks

For many months we have noted the foreboding gap that was building between plunging real economy sectors (like materials and energy at lower purple arrow in first chart below) and still levitating, expanding leverage sectors like financials (in mauve at top) and real estate investment trust shares (REITs in black at top).

TSX sectors and index Nov 30 2015
As interest rates plunged since 2011, income-seeking buyers kept herding into dividend paying equities.  These companies meanwhile became obscenely overvalued even as their revenues turned down.  Trying to keep the dream alive, they began borrowing funds to buy their own shares and maintain and increase dividends.

Think about it in practical terms for a moment.  If your business is under pressure because revenues are falling, is the smart play to a) reduce your expenses and try to figure out ways to grow revenue or b) keep borrowing money so that you can pretend and extend and burn through cash on non-essential activities?

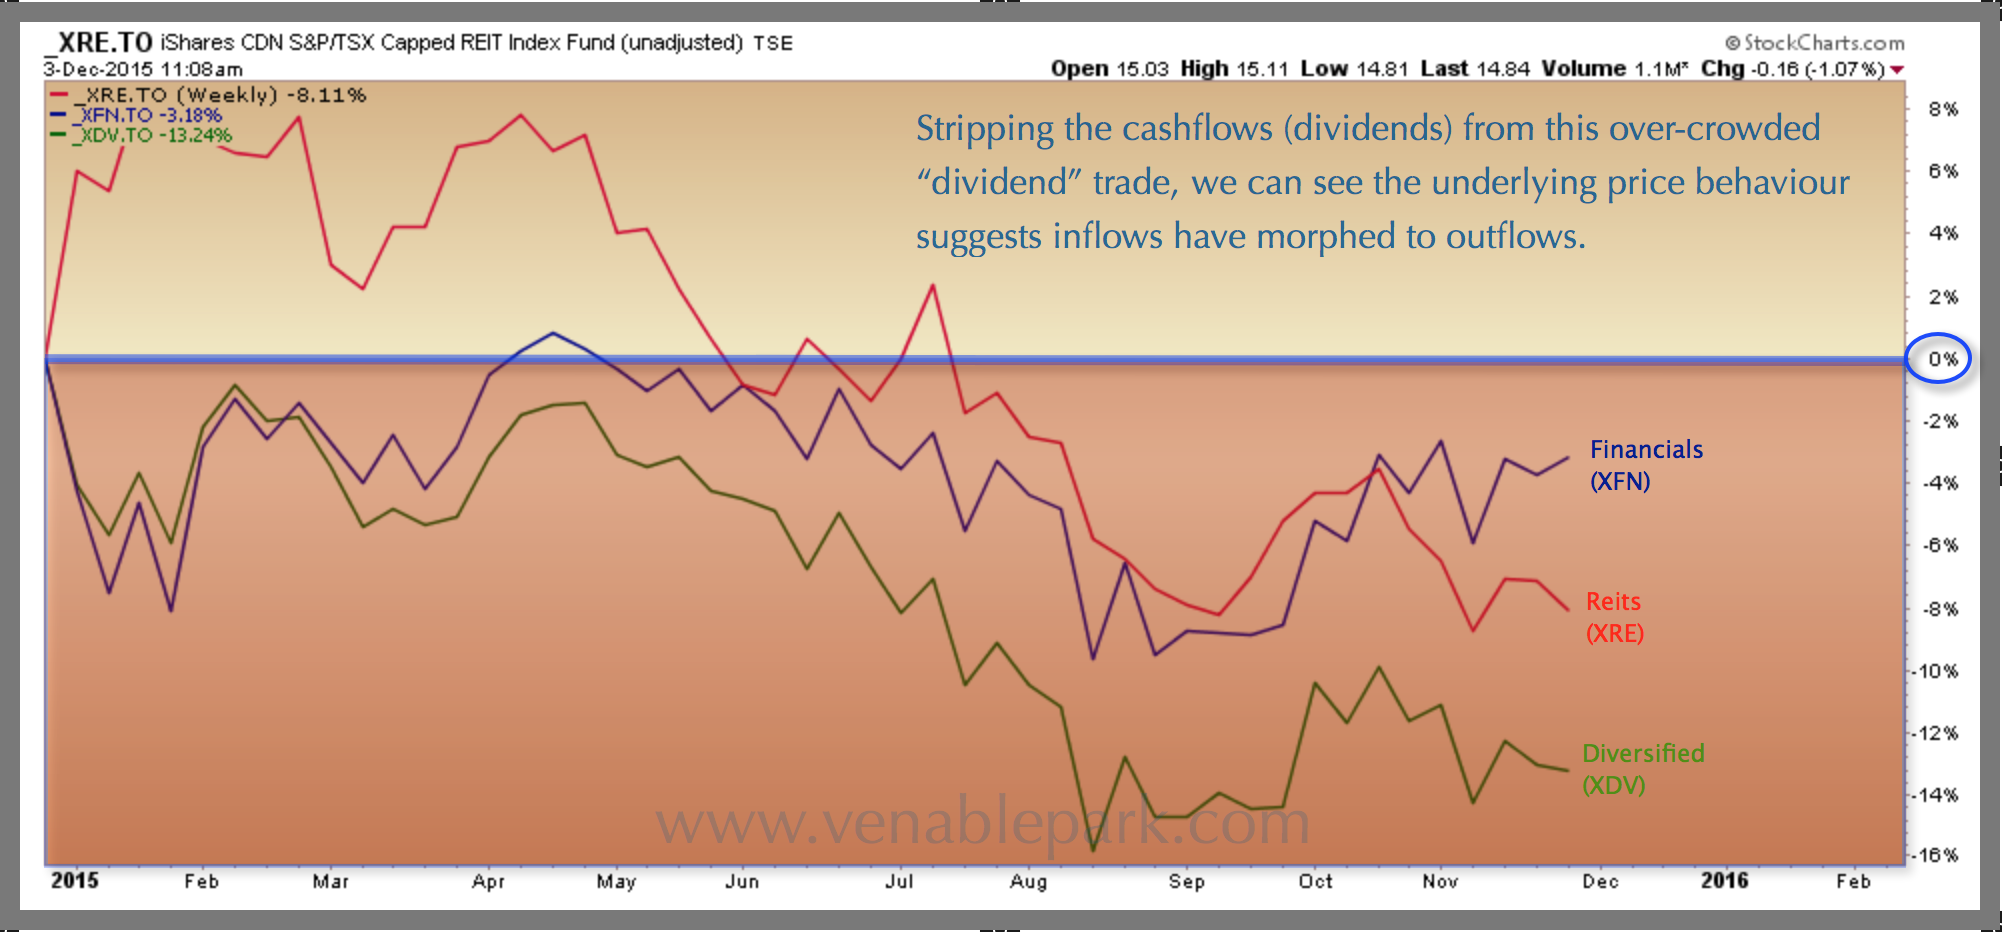
Well company management has been going with the short-term gain, long-term pain strategy inherent in option b) and now the short-term gain period has ended.  As we can see in this next chart, stripping out payments made to holders since 2014, the share prices of dividend paying sectors (XFN, XRE and XDV) have been falling.
Dividend paying sectors Dec 3 2015
This should be taken seriously by those still hoping that income will be enough to make up for capital loses in the mean reversion phase. As can be seen in our first chart above, the wide chasm now under dividend paying sectors is huge and menacing for capital allocated there. And if historical correlations hold, the short term out-performance of these sectors and indeed the broader market (TSX in red top chart), is not long for this world.  A catch-down period lies in the offing.

Posted in Main Page | Comments Off on Short term gains purchase longer term pain for dividend stocks