On May 27, 2011 my partner Cory Venable did this long-term view of copper since 1996. The chart highlighted that other than the anomalous, credit-induced peaks of 2006-08 (credit derivatives bubble) and 2011 (QE mania), cycle tops for copper have been in the $1.20 a pound area (dotted green line), and that if price were to retrace through the $2.85-3.00 area, a retest of the $1.60 level (the 2009 cycle low) seemed likely.

At the same time, next below was Cory’s chart of oil since 1991 highlighting that the bubble peaks of 2008 and 2011 were similar extreme price points and that a reversal through $90-100 a barrel seemed likely in the aftermath followed by a retrace to test secular support around $45-50 a barrel (purple dotted line along bottom).
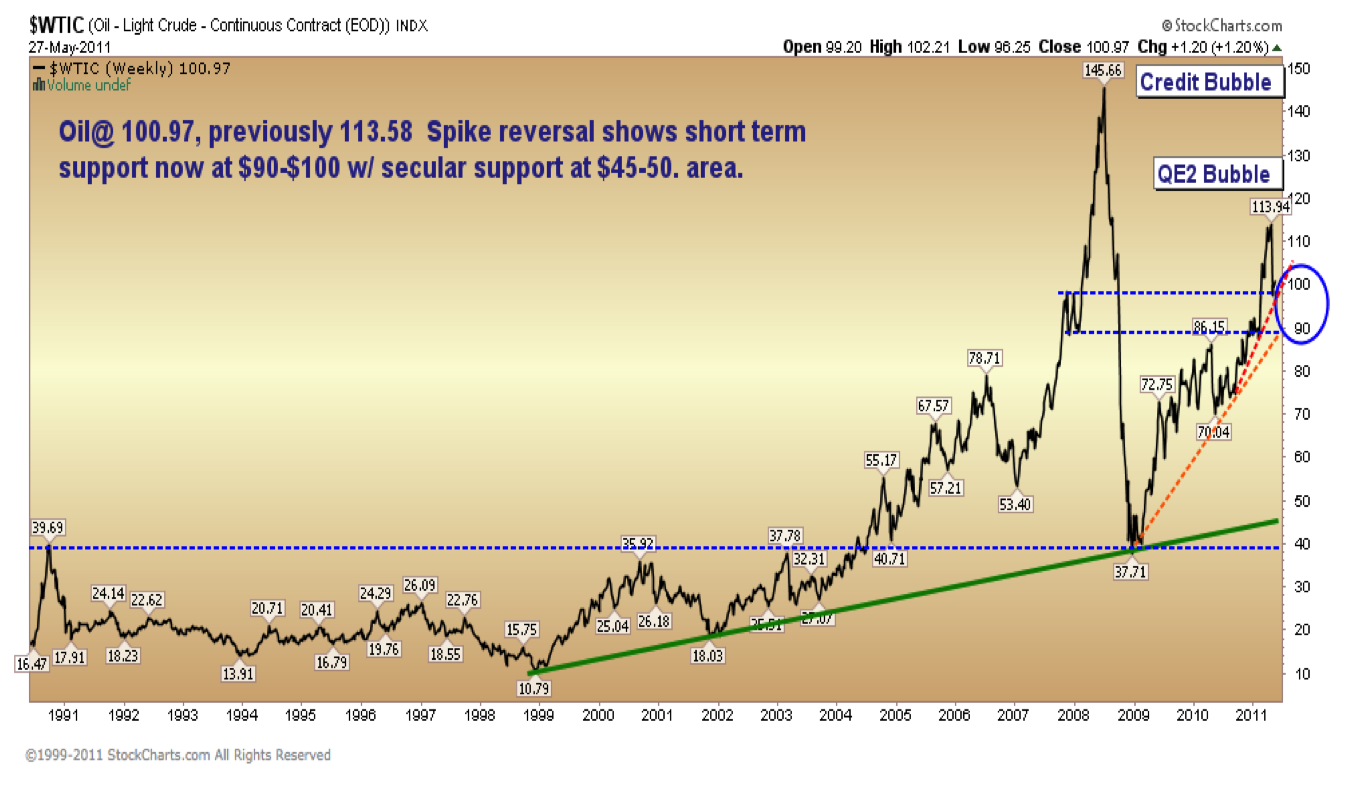
Our operating thesis was that an unprecedented global credit bubble had driven both key commodities, demand for goods and most other asset markets to unsustainable peaks that were likely to mean- revert as global spending weakened under debt and aging demographics. This was far from the consensus view at the time.
Today we offer the following update which includes a long term view of both oil (blue line, left axis) and copper (brown line, right axis) since 1991. West Texas Crude has in fact retraced some 55% to date, retesting its long term secular support in the $45 area. Copper has fallen 51% since 2011, but still has a further 28% to fall before it too can retest secular support (dotted line).

Even through massive declines to date in these key market indicators, lagging economic indicators (like last Friday’s US payroll numbers) and belief in central bank magic have so far managed to keep bullish sentiment of price-insensitive participants near all time highs and bearish sentiment near historic lows. But it seems likely that a further downside test of secular support for both key commodities as well as stock and corporate bond markets is yet to come. And yes… one could see this downturn coming. It has been baked into the reckless bets and leverage of the last 10 years.