Climate change: admit, reform and solve

The warming effects of burning fossil fuels have been documented by scientists since at least 1824. And yet deniers persist. Another presidential candidate debate last night without a single reference to the most pressing issue for the economy and civilization: unsustainable resource management and environmental devastation.

Bill Nye, chief executive officer at Planetary Society, explains the importance of science and education in U.S. innovation and discusses the lack of investment in science and energy exploration. Here is a direct video link.

Posted in Main Page | Comments Off on Climate change: admit, reform and solve

What oil and copper are telling us

On May 27, 2011 my partner Cory Venable did this long-term view of copper since 1996. The chart highlighted that other than the anomalous, credit-induced peaks of 2006-08 (credit derivatives bubble) and 2011 (QE mania), cycle tops for copper have been in the $1.20 a pound area (dotted green line), and that if price were to retrace through the $2.85-3.00 area, a retest of the $1.60 level (the 2009 cycle low) seemed likely.

Copper June 2011

At the same time, next below was Cory’s chart of oil since 1991 highlighting that the bubble peaks of 2008 and 2011 were similar extreme price points and that a reversal through $90-100 a barrel seemed likely in the aftermath followed by a retrace to test secular support around $45-50 a barrel (purple dotted line along bottom).
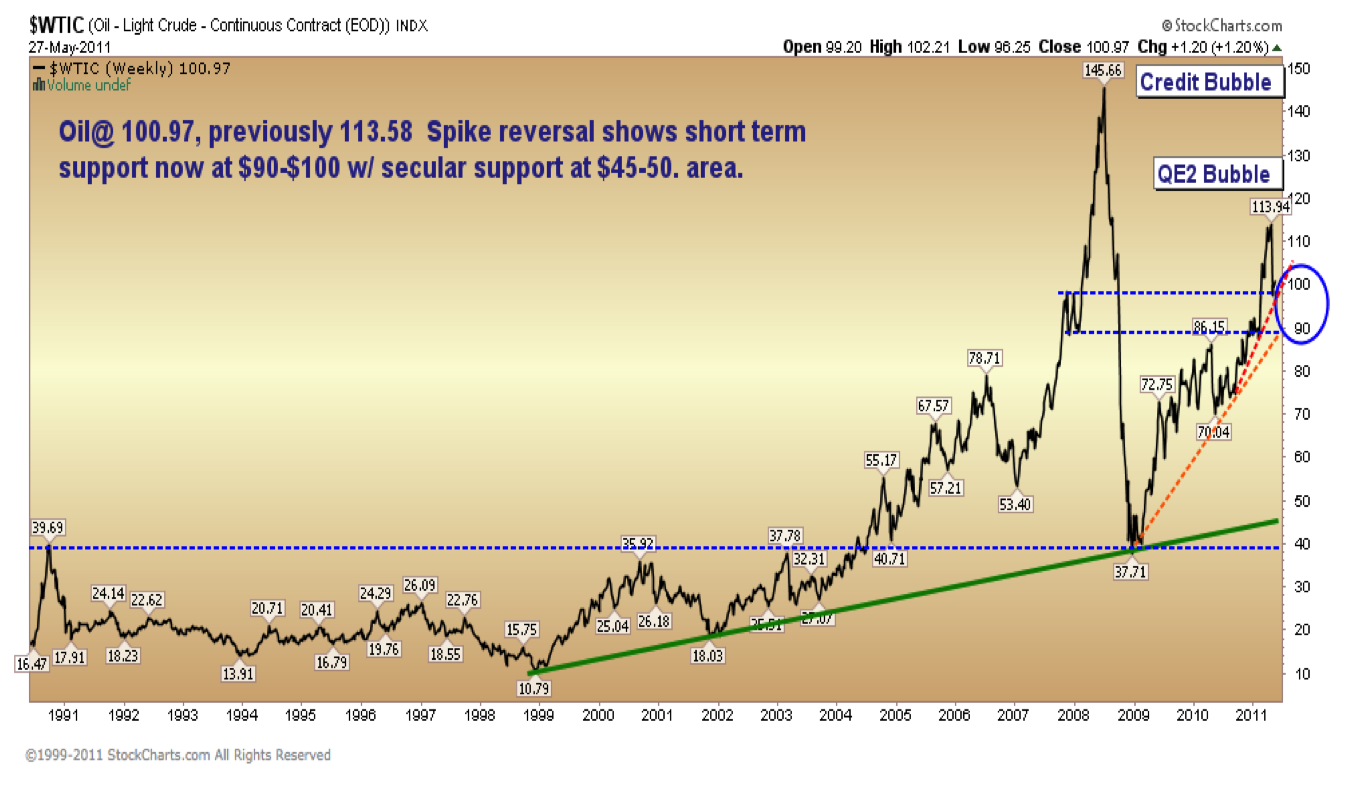
Oil June 2011
Our operating thesis was that an unprecedented global credit bubble had driven both key commodities, demand for goods and most other asset markets to unsustainable peaks that were likely to mean- revert as global spending weakened under debt and aging demographics.  This was far from the consensus view at the time.

Today we offer the following update which includes a long term view of both oil (blue line, left axis) and copper (brown line, right axis) since 1991. West Texas Crude has in fact retraced some 55% to date, retesting its long term secular support in the $45 area.  Copper has fallen 51% since 2011, but still has a further 28% to fall before it too can retest secular support (dotted line).
Copper and oil Nov 10 2015
Even through massive declines to date in these key market indicators, lagging economic indicators (like last Friday’s US payroll numbers) and belief in central bank magic have so far managed to keep bullish sentiment of price-insensitive participants near all time highs and bearish sentiment near historic lows.  But it seems likely that a further downside test of secular support for both key commodities as well as stock and corporate bond markets is yet to come.   And yes… one could see this downturn coming.  It has been baked into the reckless bets and leverage of the last 10 years.

Posted in Main Page | Comments Off on What oil and copper are telling us

On oil, rents and REITS

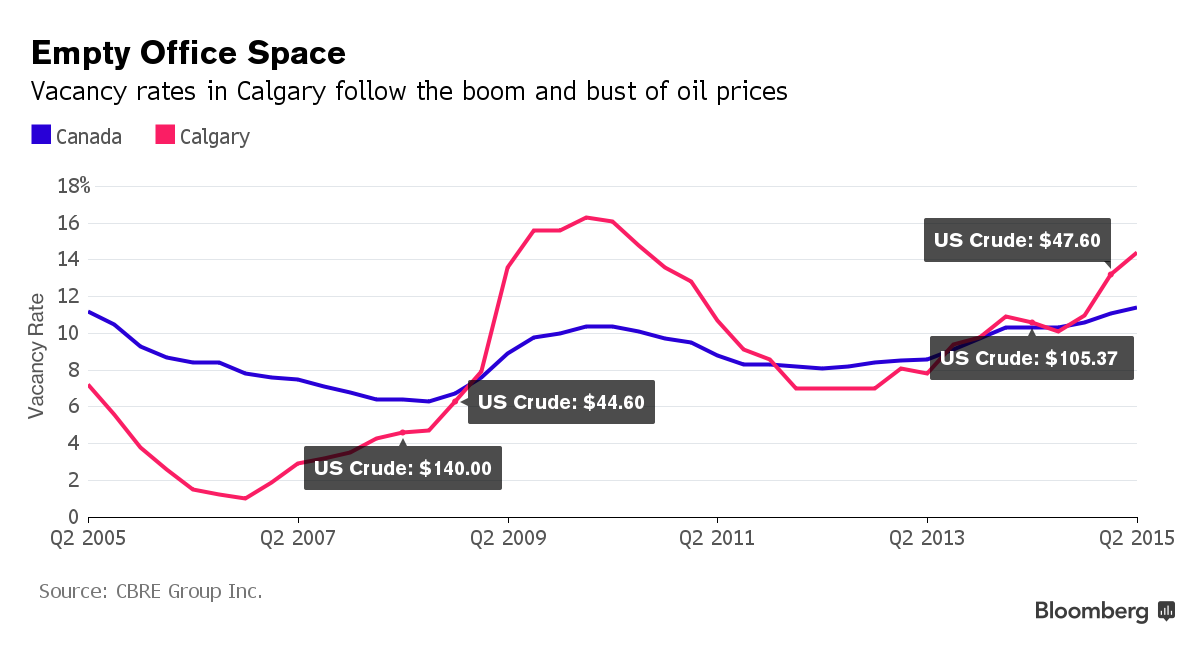
The vacancy rate in downtown Calgary jumped to 14% in Q3 (not including some 2 million square feet of so-called “shadow vacancy” or space leased but sitting empty, which if counted would push the vacancy rate to 16%, the most since the 1980s downturn. See: Empty floors, shadow vacancies, new norm for Calgary tower owners.

Office-tower owners in Canada’s energy hub are about to feel the full force of the oil-price crash.

Vacancy is already at a five-year high in Calgary and rents are the lowest since 2006 after thousands of office jobs were cut. Energy company tenants have now begun to ask for rental relief and are offering subleases for as little as half the going rate, according to real estate brokers including Jones Lang LaSalle Inc. and Avison Young Canada Inc.

That’s before five new office towers with about 3.8 million square feet (353,031 square meters) of space hits the market in the next three years.

“It is a bloodbath,” said Alexi Olcheski, an office-leasing principal at Avison Young from his office in downtown Calgary. “We’re at the highest point of fear and uncertainty now.”

Calgary office spaceAlthough Calgary and Alberta broadly are the epicenter of this latest oil led-downturn, they are not islands.  Toronto, Montreal and Vancouver office space are also due for downsizing after years of expanding accounting, legal and finance firms during the oil and commodities boom 2002-2008(11).  And then there are the many REITS which not only have exposure to falling rents and vacancy rates in office space, but also in the consumer retail sector now garishly overbuilt in Canada (the nation with the distinction of having the highest household debt levels in the G7 today).   Previous favorites–REITS and finance shares–have now started what should be a major cyclical correction.  They’ve earned it.

Caught in the downturn are tower owners including Dream Office REIT, Artis REIT and Morguard Corp., whose shares have dropped about 27 percent, 14 percent and 5.1 percent respectively over the past 12 months. The Standard & Poor’s/TSX Capped REIT Index is down 8.7 percent over the same period compared with a 8.2 percent drop in the broad S&P/TSX Composite Index. U.S. crude has dropped more than half since its peak in June 2014 to hover around $45 a barrel.

Posted in Main Page | Comments Off on On oil, rents and REITS