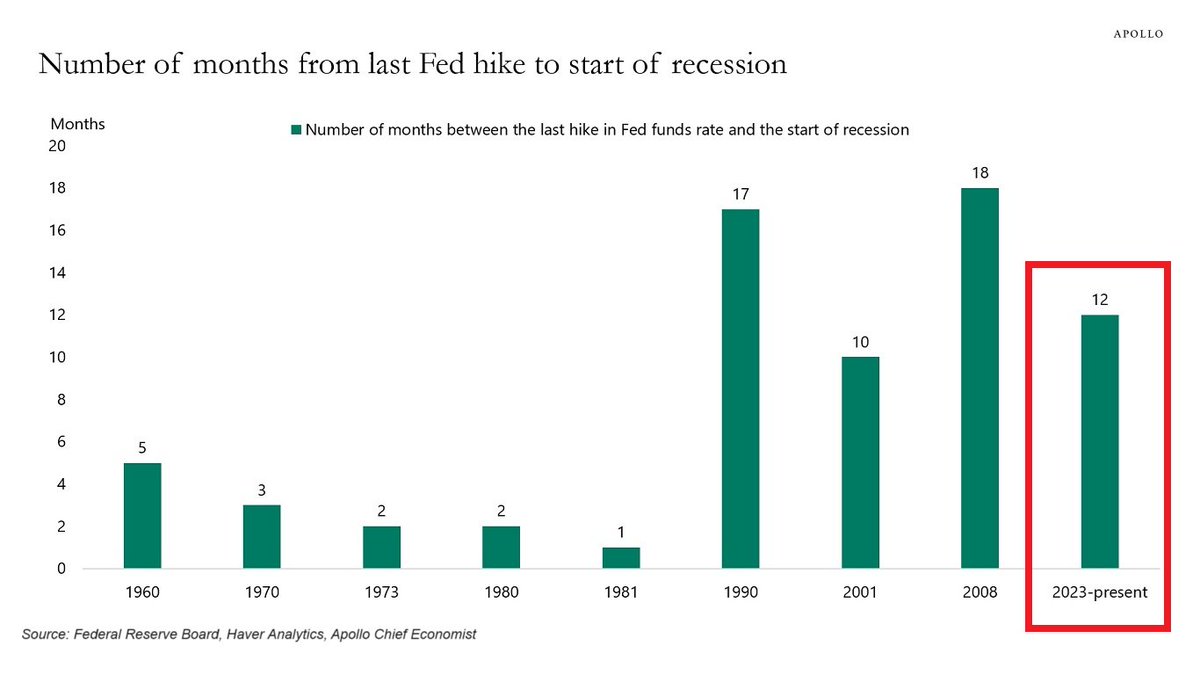
Consumer spending drives just under 60% of Canadian GDP growth and consumer spending fell across all categories in June–discretionary and essential (shown below courtesy of RBC). Warm weather and declining interest rates did not entice spending as hoped. Overall, second-quarter retail sales were negative.
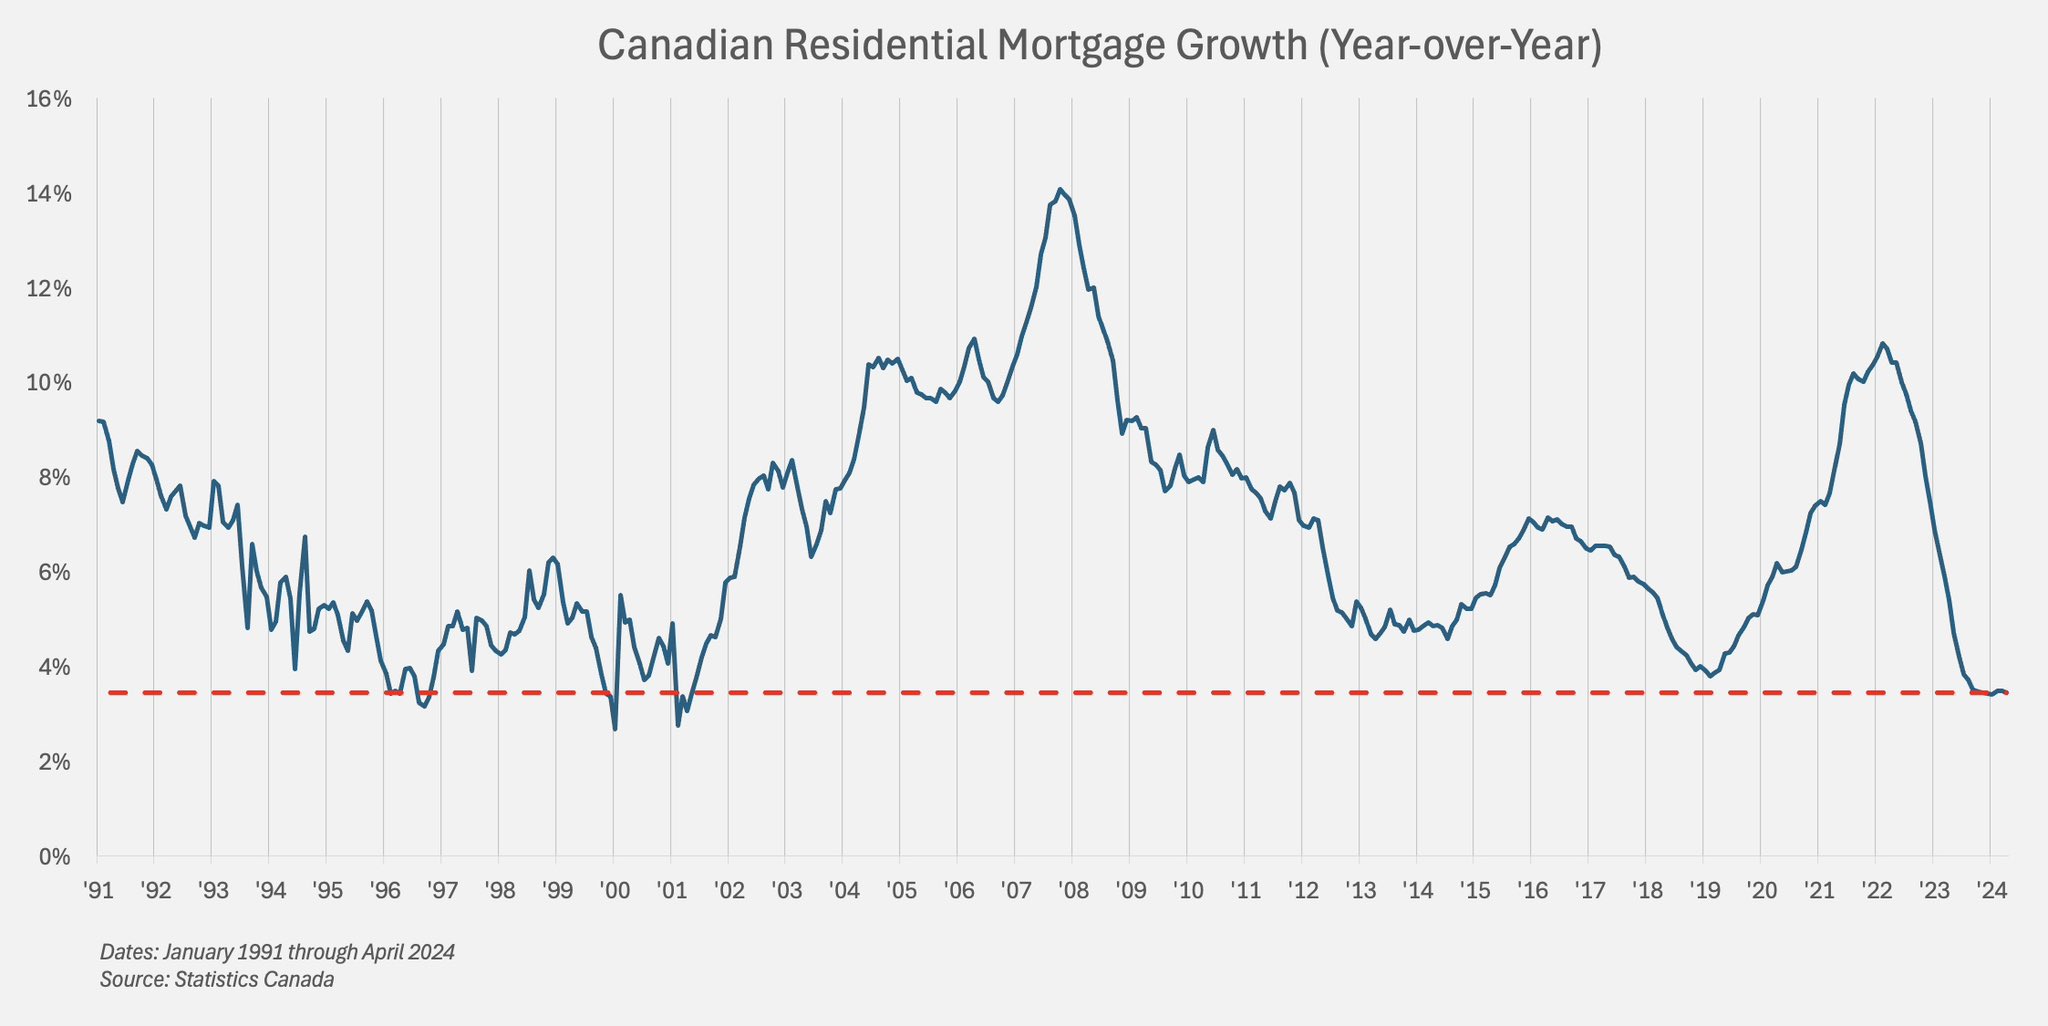
Fewer Canadians have renovated their homes amid a sluggish housing sector, while food services spending posted weak growth on a three-month moving average. Hotel spending softened and tourism demand is still sitting below pre-pandemic levels. Canadian Treasury bond prices have been rising since last October (lowering yields and fixed-term loan rates) and the Bank of Canada began easing short-term rates last month. Still, the year-over-year growth in residential mortgages has been the weakest since the 2001 recession, 23 years ago (courtesy of the latest CMHC report and chart source).
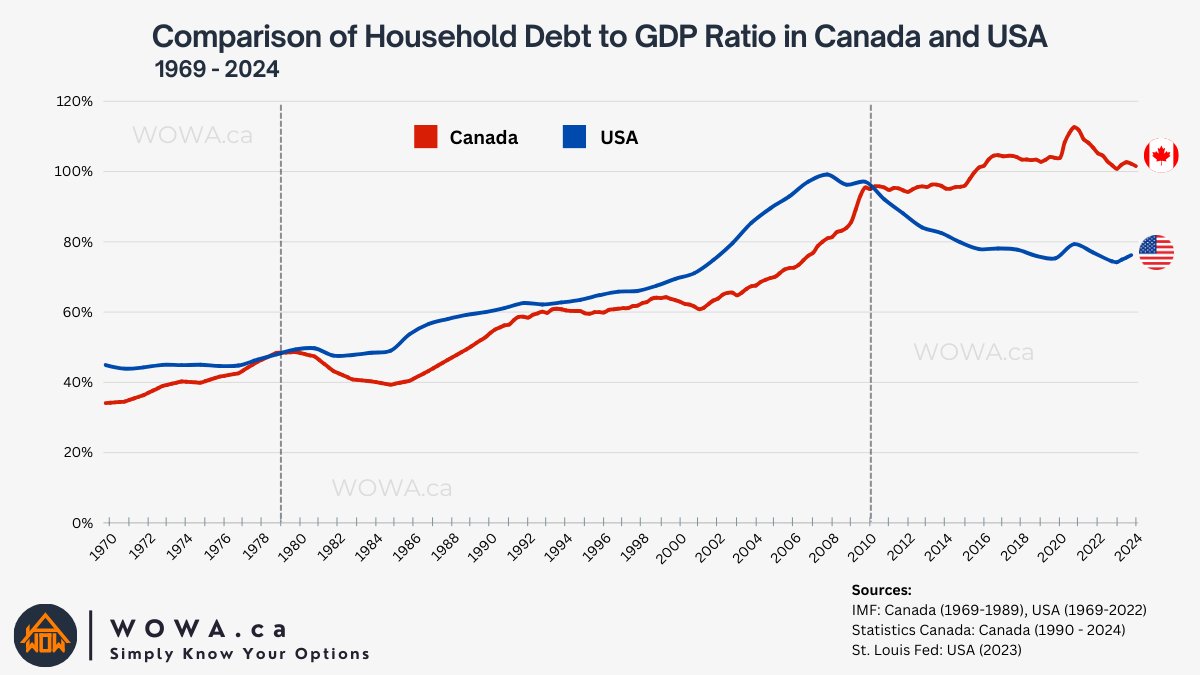
 With unemployment at 6.4% and expected to rise through 2025, and households heavily indebted (Canadian household debt to GDP ratio below since 1970 in red, versus the US in blue), lower interest rates are unlikely to stimulate spending for some time.
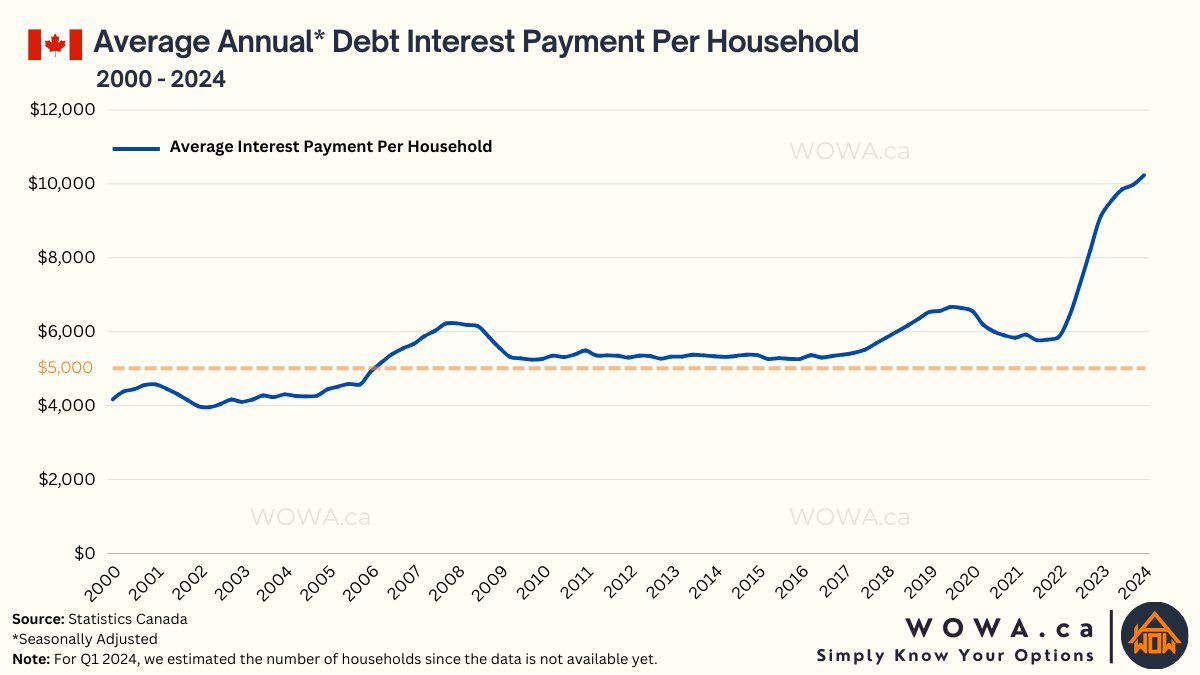
  The average annual interest payments per Canadian household have risen 66%+ in the past 2 years, by far the sharpest increase in more than 24 years (shown below since 2000).
 Canada has dug itself into a period of tough slog. RBC explains in Warmer Temperatures Failed to Ignite Canadian Consumer Spending in Q2:
“…we don’t expect a turnaround in the near term. While the Bank of Canada’s cutting cycle is underway after an initial 25 basis point cut in June, interest rates are still very restrictive as homeowners grapple with the impact of mortgage renewals. It will take time for the impact of BoC cuts to ease consumer pain.
Similar problems are undermining US consumption (which drives 70% of US GDP growth and the world’s largest economy). See Big Banks Warn of Weakness among lower-income Consumers):
Consumer sentiment remains “stubbornly subdued” and fell to an eight-month low of 66, according to the latest University of Michigan survey released on Friday.
Profits at Citi’s US consumer lending business, which includes credit cards, plunged 74 per cent from a year ago. The bank’s chief financial officer, Mark Mason, said consumer spending was slowing overall, with account balances now lower than they were before Covid.
US consumers were more cautious than they had been in a while, he added. “We are not seeing the same growth in consumer spending that we had in prior quarters,” said Mason. “There was less traffic in the retail venues that we partner with.”
Best to accept facts, respect the business cycle, and be prepared for opportunities that inevitably come out of the depths of recessionary periods.

