
Stocks swirling in Fed’s tornado of reckless endangerment

At 27.6 the Crestmont price to earnings ratio for the S&P 500 is 98% above its historical average (arithmetic mean), putting current stock valuations at the 98th percentile of this 140 years+ series, second only to the tech wreck top in 2000.  See the yellow “We are here” dot indicated in this big picture chart from Doug Short below.
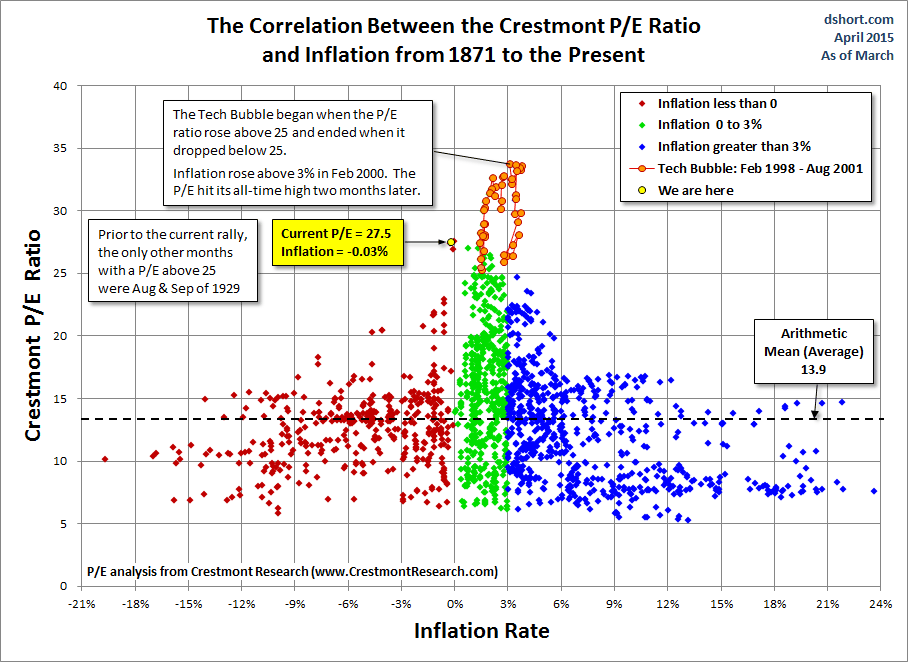
Crestmont-PE-inflation-correlation-with-tech-bubble Not in Kansas anymore folks…holders of equities are snoozing inside a house that has been sucked into a Fed induced tornado, and is now swirling ’round in the sky.

Dorothy's house in tornadoDon’t be distracted by all the sell side jockeys assuring everyone that the house can swirl indefinitely.   As reminded by 720 Global’s Michael Lebowitz last week:

Thoroughbred race horses occasionally wear blinkers so their focus is on the track in front of them and not on the horses around them. Our simple advice; wear blinkers. As difficult as it is, make intentional efforts to ignore the commonly uninformed chatter of friends and colleagues and the self-serving guidance offered by Wall Street economists and the media. Do your own homework and make sure your clients understand the value of your independent analysis.

Value investing, when done objectively, offers a strategy for investors to ignore the herd. The best in class understand that wealth is preserved by avoiding losses. They are not beholden to trends or momentum, nor are they distracted or obsessed by others investments.  They simply have the courage to divest of or shun assets priced above fair value in the midst of euphoria.

Although it seldom attracts the praises of the crowd, great investors who follow this simple courageous strategy do so with confidence in a favorable outcome.
Posted in Main Page | Comments Off on Stocks swirling in Fed’s tornado of reckless endangerment

After the oil rush: thoughts on secular cycles

Since Canadian oil sands benchmark Western Select Crude (WCS) sells at a discount of 25%+ to West Texas Crude (WTI) (see here), Canada has the distinction of producing the lowest valued oil in the world.  Due to high monetary costs of production it is also some of the least profitable, and that is just in terms of the costs that are officially counted.  (For a 7 minute Greenpeace video report on the many costs of oil sands production that are not included in current profit and loss statements, see here.)

A recent Canadian Energy Research Institute (CERI) study put the West Texas Intermediate (WTI) break-even price for existing steam-driven oil sands projects at $84.99 a barrel and $105 for new mines.  See:  Is oil sands development still worth it? Today WTI is trading around $50/barrel.

Despite negative returns at current prices, a report from the National Energy Board projects that Canada’s oil output is set to climb to 3.89 million barrels a day this year, mostly driven by oil sands producers, whose output will increase 8.3% (upgraded synthetic crude included).  The Financial Post reports that a total of 14 new oil sands projects are scheduled to start in 2015–36% more than in 2014.

Proponents (including Canada’s federal government) argue that the downturn in oil will be short-term and that production should continue to be ramped–necessary short-term pain for expectations of longer term profits.

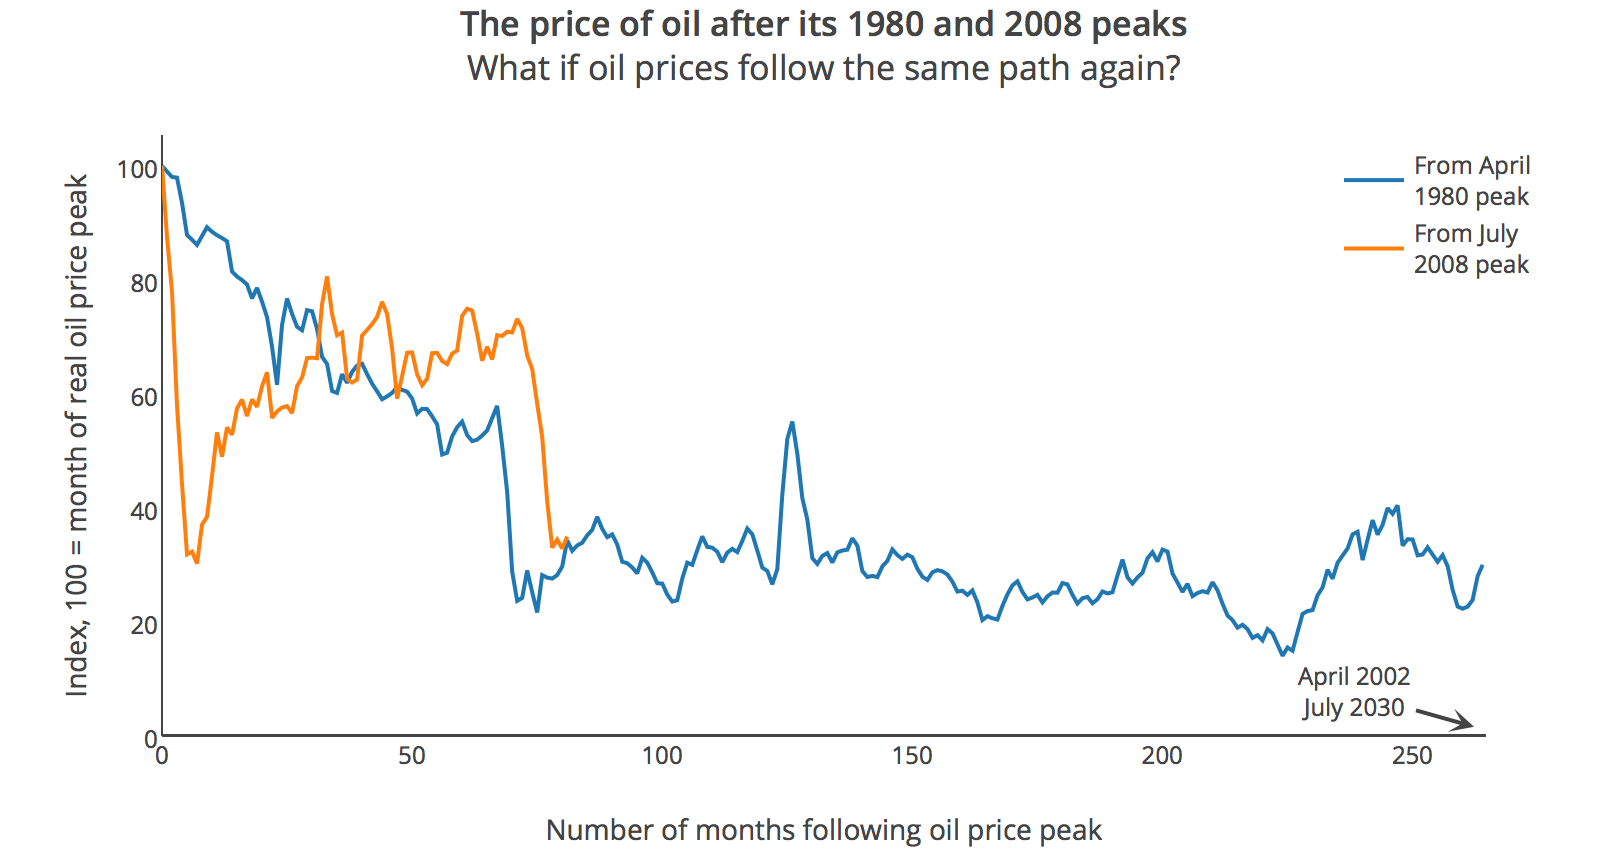
The truth of course, is that no one can know for sure what will happen to prices next.  However, secular boom cycles in energy have historically been followed by long periods of secular decline, and it is probable that this one will prove no different.  Indeed thanks to the record over-investment of the latest credit bubble, the mean reversion this time should arguably be deeper and longer than usual.

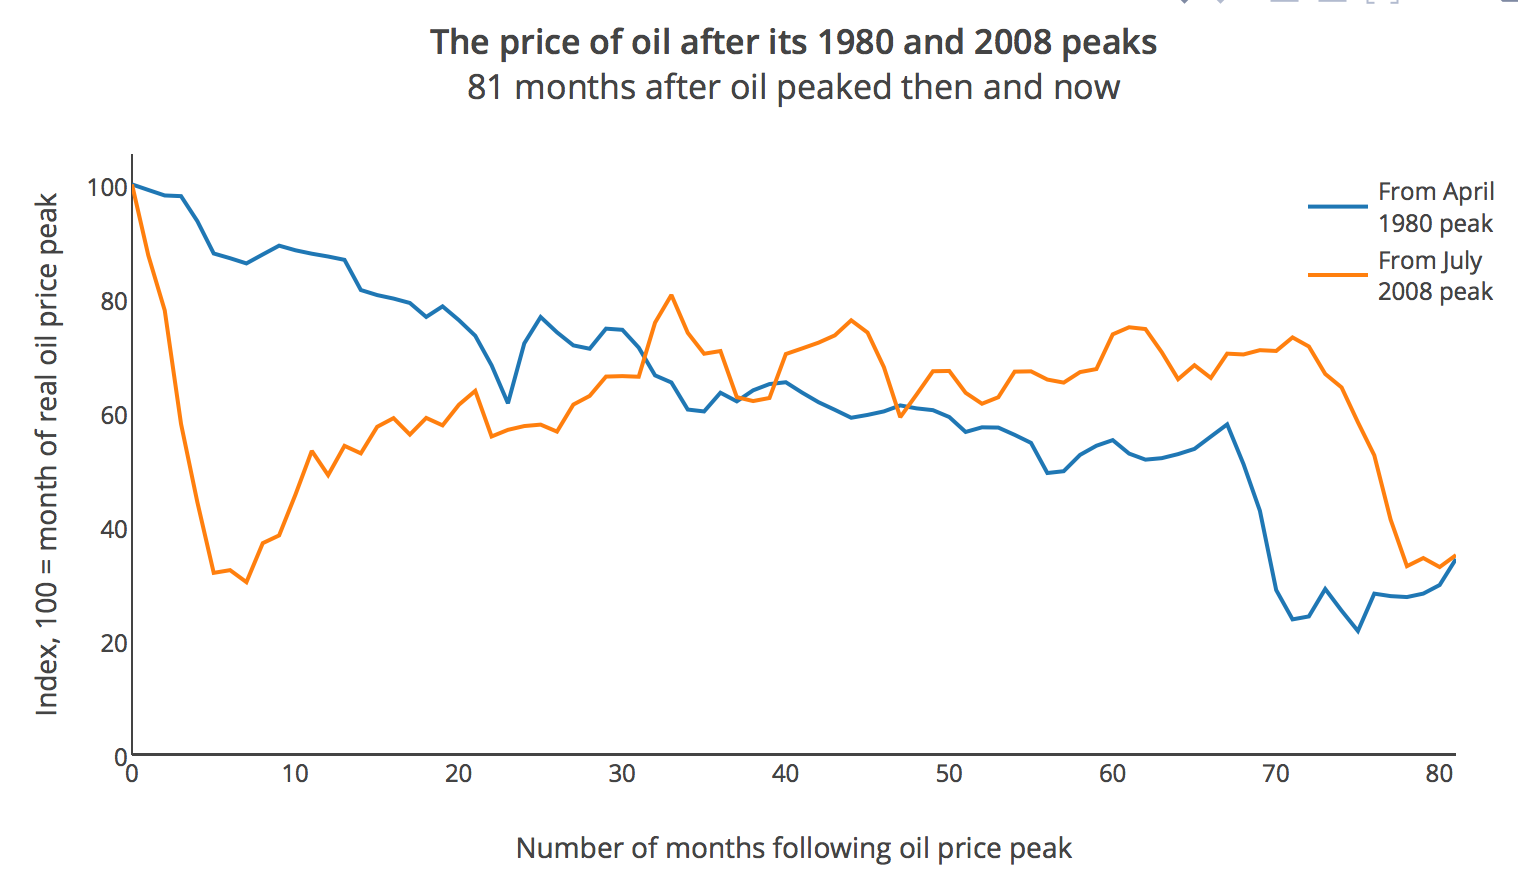
The price action for WTI over the past 81 months since July 2008 certainly so far resembles the price action in the 81 months that followed the last secular peak in April 1980 as shown below.  See:  Its crazy how close oil has tracked the 1980s crash

Screen Shot 2015-04-09 at 2.48.01 PMThe question now, is whether it will continue to follow the downward trend over the next 10+ years as it did following the 1980 peak and bust.  There are many reasons to think that it could.

Screen Shot 2015-04-09 at 2.47.28 PM

Posted in Main Page | Comments Off on After the oil rush: thoughts on secular cycles

GE backs out of banking while the goin’s still good

Genius is before the fall. Rescued by government loans in the 2008 meltdown, Jeff Immelt is looking to exit the risky operations of GE’s finance arm, before chickens come home…

Real-estate investments and lending aren’t an obvious fit with GE’s better-known businesses of building advanced aircraft engines, power turbines and medical devices. But finance has been a big business for the company under Mr. Immelt, who plowed billions of dollars into property and other investments in search of profits.

The strategy worked until the financial crisis shook the company in 2008 and 2009, forcing it to turn to government-backed lending programs for support and ultimately prompting GE to slash its dividend.

Mr. Immelt has expressed regret about expanding GE Capital going into the crisis. “Clearly in retrospect, you know, I didn’t get that right,” he said…  See: GE seeks exit from banking business. 

What will GE do with the cash raised on the sale?  Why buy back even more of their own shares of course.  Here is a direct video link.

Posted in Main Page | Comments Off on GE backs out of banking while the goin’s still good





