Venturing back to 2009?

My technician partner, Cory Venable, gave me the chart below of the Canadian Venture exchange for a presentation I was giving in September 2012.  Although metals, minerals, mining and energy companies had rebounded sharply from the 2009 lows, by 2011 they began falling again in a series of dramatic drops and rallies.  The consensus view was that the sector was building a base and would soon rebound to new highs on rabid Chinese demand and QE liquidity from the west.
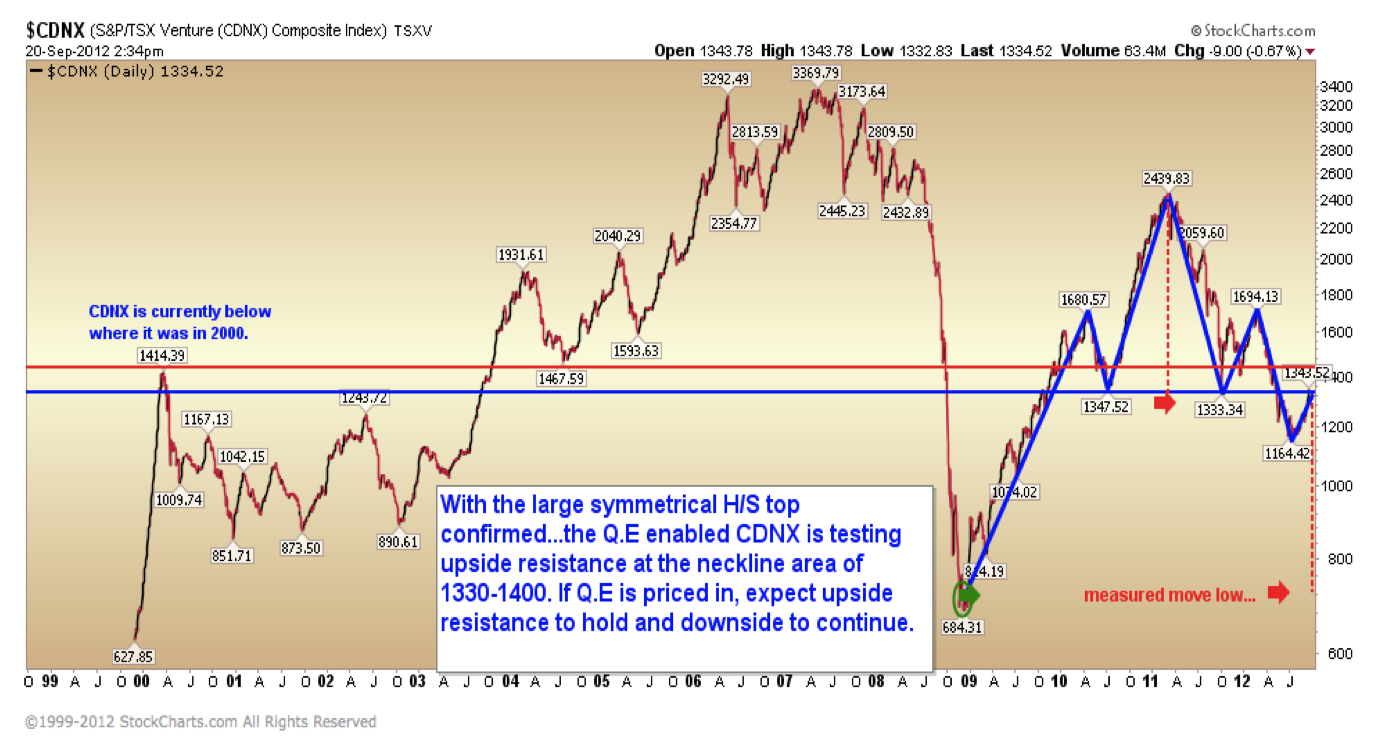
Venture-2012-secular-viewAs shown in his comments and notations above, contrary to the consensus view, Cory’s work suggested that a break below 1330 was likely to prove fatal to bullish beliefs, and see the Venture retrace all the way back to the 700 area from which the commodity boom had originally launched in 2000.   His technical assessment lined up well with our fundamental, macro, behavioral and historical cycle analysis that suggested the deflating credit bubble would suppress consumption and global growth for a decade or more, as excess inventory and asset values worked back down in line with household spending power in the real economy.

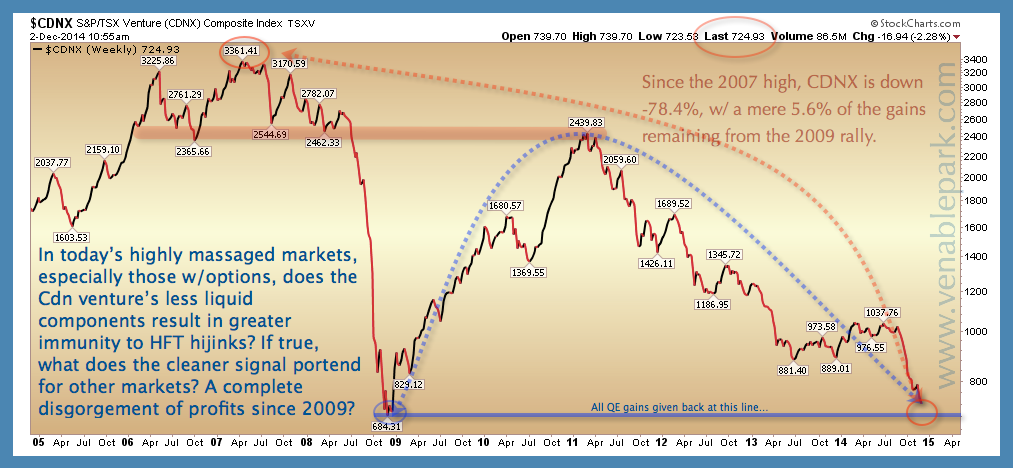
Fast forward a little over 2 years later, and here is Cory’s chart of the same index today.  There is no question that QE mania slowed the retracement process.  But not the end result:  today just barely above its 2009 low, all price gains in this index have indeed completely evaporated.
CDNX Dec 2014The pivotal questions now are these:

  1. will the 2009 bottom be enough for the Venture to find lasting support this cycle or will further declines follow once still bullish consensus capitulates to a fresh period of slowing growth and deflation now underway in the world?
  2. If the Venture retains its historical correlation with broader equity markets like the S&P 500, TSX and Russell 2000, isn’t it likely that they too will need to venture back towards their 2009 lows (possibly even lower) before mean reversion completes this epic cycle?
Posted in Main Page | Comments Off on Venturing back to 2009?

The Christmas Story

Whether you are Christian or not, this story of Christmas as told by the children of St Paul’s Church, Auckland, New Zealand is gorgeous.  A smile to start the day. Here is a direct video link.

Posted in Main Page | Comments Off on The Christmas Story

Credit-fueled commodity bubble imploding

I recall being on an ‘experts’ panel at a resource investing conference in Calgary in 2011 when commodity prices had sharply rebounded out of the 2008 collapse and the question was asked, “do you think the ‘great commodity bull’ market has ended?” I was the only person on the panel who answered yes.  Since then as I have continued to write and speak on this topic, I received a regular flow of correspondence from commodity bulls who insisted I was everything from wrong to a fool, and demanded I , “stop saying such ridiculous things.”

None of this is rocket science.  Commodity booms are an investment cycle that begin out of scarcity and end amid an embarrassment of supply. This particular run was greatly magnified by the credit bubble from 2001 to 2008 and then QE-financed speculation between 2009 and 2013. Credit magnification works both ways, and so the mean reversion now in process is likely to be equal and opposite as prices deflate. Rapid declines serve to implode levered players. And since most market participants are not proactive, independent thinkers, but rather herd following masochists, losses that are highly predictable are always “unexpected”.

We now seem to be in the early stages of the belief phase, where a growing consensus begins to recognize just how dumb past narratives have been.    See a summary on oil moves here:  Oil at $40 possible?  The answer, as shown below, seems to be yes.

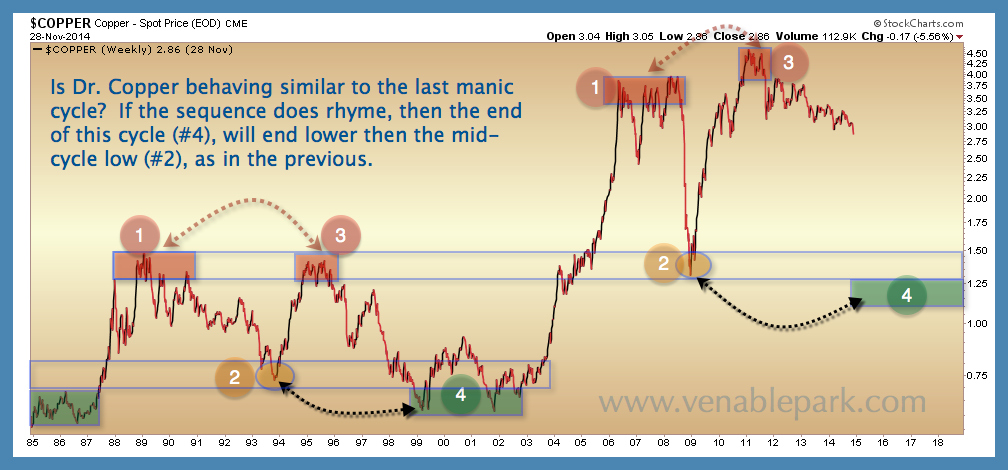
Oil Nov 26 2014At the same time, Copper, perhaps the commodity most over-produced, stockpiled and price-rigged by financial intermediaries the past few years (see How JP Morgan struck gold with copper), has finally broken down beneath the $3.00/lb level it had mysteriously hovered above since the 2009 rebound.

In 2007-09, pretty much every commodity and stock market plunged 30 to 70% before bouncing off long-term support into a breathtaking “V” rebound on the belief that government injected liquidity could offset the weakness of a secular decline in consumer demand.  But that was 2009 and this is now.  Now is a time with more debt, and an even older population, in most countries.  If we are to truly to correct from the excesses of the credit bubble, then previous cycle lows in 2009 are unlikely to prove sufficient this time. In addition, once it begins, the next cyclical rebound is likely to be considerably slower than the last, as participants shift from an era of reckless gaming to one of sober investment.  Here is a big picture view of the copper spot price since 1985.

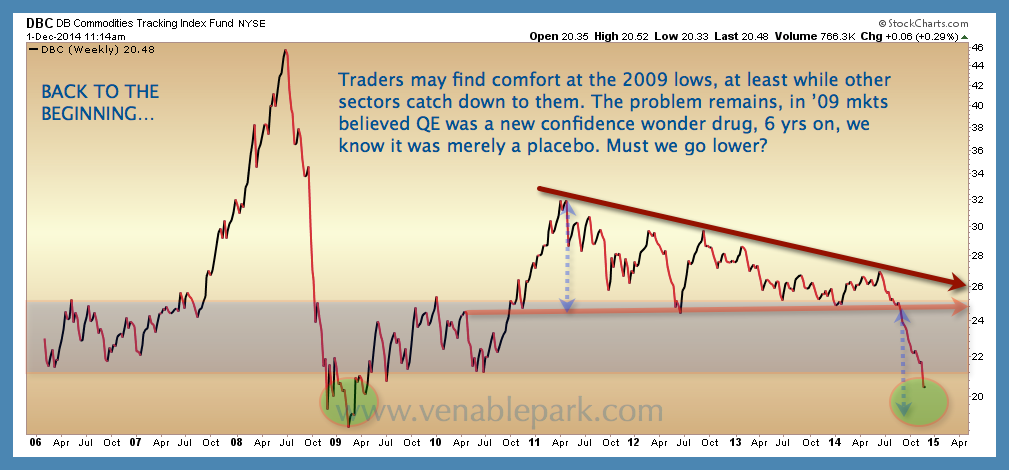
Copper Dec 2014And of the Commodities Index (DBC) since 2006.

Commodities index Dec 2014With the largest share of global capex and R&D spending coming out of the commodity sector since 2006, crashing profits there will spread further weakness across the broad economy (particularly investment banks) as investment and dividend programs are now necessarily scaled back.

Posted in Main Page | Comments Off on Credit-fueled commodity bubble imploding