Thinking about the sugar drug this Halloween week

Last Week Tonight’s Jon Oliver looks at sugar. Here is a direct video link.

The aspect I have always found most disturbing is the potentially lasting harm we are inflicting on the health of our youth. I actually see it as a widespread form of child neglect and abuse today. We don’t allow companies to market drugs and alcohol to kids. Child protection laws are expected to intervene if adults are found giving drugs, alcohol and cigarettes to children. And yet we condone and inflict similar damage every day through diet choices and giving free rein to the big food industry . Their profits are quite literally coming at the long-term expense of all of us. See: Drinking a ‘medium’ soda every day can age you as much as smoking does:

“Just as soda companies plunk down millions of dollars to defeat local soda-tax ballot measures, researchers have found a link between regular soda consumption and premature aging.

Published in the peer-reviewed Journal of Public Health, a study of 5,300 adults compared the cells of people who drink soda every day to those of their non-soda-drinking counterparts. In the soda group, the ends of the chromosomes—known as telomeres—were shorter, a sign of their cells’ diminished ability to regenerate. Our telomeres naturally shorten as we age, but scientists have discovered that a few behaviors—including smoking—can shorten them prematurely.

And here’s the really interesting part: People who drank a 20-ounce soda every day experienced an additional 4.6 years of telomere aging—the same amount observed in smokers. “The extremely high dose of sugar that we can put into our body within seconds by drinking sugared beverages is uniquely toxic to metabolism,” lead author Elissa Epel, a professor of psychiatry at University of California-San Francisco, told Time.”

Posted in Main Page | Comments Off on Thinking about the sugar drug this Halloween week

Oil breaks below $80

Oil (WTI) has broken below $80 this morning on the back of surging global production, weakening demand and the strengthening US dollar. Canada’s Federal budget forecasts are based on oil north of $95 a barrel…at current levels and lower, deficits will mount in Canada and other energy exporters.

“Goldman Sachs has slashed its 2015 oil price forecasts, making it the most bearish among major financial institutions, following a near 25 percent fall in crude prices over the past five months.

The U.S. investment bank said rising output will outstrip demand—with its forecast weighing further on benchmark Brent crude prices—as forecasters generally pare back estimates for oil due to global growth, a strengthening dollar and ample supplies.

Goldman analysts said in a report released late on Sunday that it expects U.S. benchmark West Texas Intermediate crude to fall to $75 a barrel and Brent to $85 a barrel in the first quarter of 2015, both down $15 a barrel from its previous forecast.” See: Goldman slashes 2015 oil price forecast

Here is a direct video link.

Secular support for oil lies in the $40 a barrel range as shown in my partner Cory’s chart below. Of course no politicians or mainstream economists have even considered what such a decline would mean for global cash flows and budgets.

Each $10 drop in oil prices transfers approximately .5% of global GDP from energy exporters to energy importers. An upside is that energy importers tend to be less wealthy countries and so more dollars in importing nations tends to have a greater multiplier effect in terms of consumer spending. On the other hand, where those consumers are heavily indebted (like today in most countries) the energy savings are more likely to go to debt repayment than increased consumption. This will be good for longer term household balance sheet repair which is desperately needed, but detracts from global growth in the near and medium term.

WTIC Oct 14 2014

Posted in Main Page | Comments Off on Oil breaks below $80

Wealth gap flashing recession warning

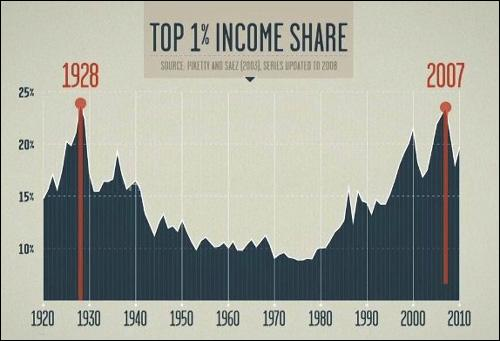
The present spike of wealth (asset values) above income coincides with similar tops in 1929, 2000 and 2007. Here is a direct video link.

This chart from the Inequality for all, documentary, also shows peaks in the top 1% of the population’s income since 1920. We can see that while the financial/leverage bubbles of 1928, 2000 and 2007 inflated incomes for the 1% holding financial assets (because total income includes stock options, capital gains and dividends) historically the effect has always been fleeting, dramatically mean reverting once asset values collapse once more. The declines also then crush government tax revenues that during the bubbles become concentrated on capital gains and inflated property values rather than employment and business income. This causes sudden and dramatic deficits for municipal to Federal budgets in the process.

Income-Inequality-Graph-from-Robert-Reichs-New-Film

Posted in Main Page | Comments Off on Wealth gap flashing recession warning