
Oil breaks below $80

Oil (WTI) has broken below $80 this morning on the back of surging global production, weakening demand and the strengthening US dollar. Canada’s Federal budget forecasts are based on oil north of $95 a barrel…at current levels and lower, deficits will mount in Canada and other energy exporters.

“Goldman Sachs has slashed its 2015 oil price forecasts, making it the most bearish among major financial institutions, following a near 25 percent fall in crude prices over the past five months.

The U.S. investment bank said rising output will outstrip demand—with its forecast weighing further on benchmark Brent crude prices—as forecasters generally pare back estimates for oil due to global growth, a strengthening dollar and ample supplies.

Goldman analysts said in a report released late on Sunday that it expects U.S. benchmark West Texas Intermediate crude to fall to $75 a barrel and Brent to $85 a barrel in the first quarter of 2015, both down $15 a barrel from its previous forecast.” See: Goldman slashes 2015 oil price forecast

Here is a direct video link.

Secular support for oil lies in the $40 a barrel range as shown in my partner Cory’s chart below. Of course no politicians or mainstream economists have even considered what such a decline would mean for global cash flows and budgets.

Each $10 drop in oil prices transfers approximately .5% of global GDP from energy exporters to energy importers. An upside is that energy importers tend to be less wealthy countries and so more dollars in importing nations tends to have a greater multiplier effect in terms of consumer spending. On the other hand, where those consumers are heavily indebted (like today in most countries) the energy savings are more likely to go to debt repayment than increased consumption. This will be good for longer term household balance sheet repair which is desperately needed, but detracts from global growth in the near and medium term.

WTIC Oct 14 2014

Posted in Main Page | Comments Off on Oil breaks below $80

Wealth gap flashing recession warning

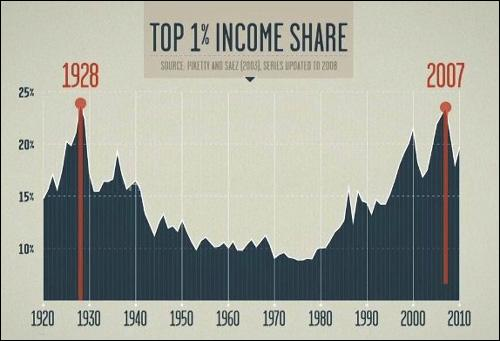
The present spike of wealth (asset values) above income coincides with similar tops in 1929, 2000 and 2007. Here is a direct video link.

This chart from the Inequality for all, documentary, also shows peaks in the top 1% of the population’s income since 1920. We can see that while the financial/leverage bubbles of 1928, 2000 and 2007 inflated incomes for the 1% holding financial assets (because total income includes stock options, capital gains and dividends) historically the effect has always been fleeting, dramatically mean reverting once asset values collapse once more. The declines also then crush government tax revenues that during the bubbles become concentrated on capital gains and inflated property values rather than employment and business income. This causes sudden and dramatic deficits for municipal to Federal budgets in the process.

Income-Inequality-Graph-from-Robert-Reichs-New-Film

Posted in Main Page | Comments Off on Wealth gap flashing recession warning

The financial engineering market

Worthwhile article by Jared Dillian, courtesy of Mauldin Economics today:

“Ten years ago, during the housing boom, the consumer was the most leveraged entity, taking out negative amortization mortgages, cashing out home equity, things like that. The consumer got a margin call, which was ugly—you know the story—and has spent the last six years deleveraging.

While the consumer was taking down leverage, the US government was adding leverage, taking the deficit to over 10% of GDP at one point. But even the government is deleveraging (for the moment), and now it is America’s corporations that have been adding leverage, at a furious pace. We’ve had trillions of dollars in corporate bond issuance in the last few years.

So when corporations sell bonds, what do they typically use the proceeds for?

In theory, the proper use for debt is to finance capital expenditures. Growth. But in this last cycle, that’s not what the money has been used for. It’s primarily been used for stock buybacks and dividends…

So what can we learn about financial engineering? It works, up to a point. In the short term, you can conceal from investors the fact that your business model is broken and you don’t have a plan. You can conceal it for a number of years, in fact. That is the thing about finance: you can suspend the laws of economics in the short term. But not forever. It will always come back to haunt you.”

Read the whole article: The Financial Engineering Market, for more insight on how IBM and other S&P companies have recklessly borrowed trillions to buyback shares and pay dividends, degrading their balance sheets for a temporary pump of stock values to unsustainable levels.

Posted in Main Page | Comments Off on The financial engineering market





