Howard Davidowitz on the Financial Survival Network

Howard has 40 years of experience in debt analysis and corporate restructuring. Agree with him or not, he’s always good for a giggle…

Howard Davidowitz, well known consultant and turnaround expert, is unhappy with the state of affairs in America today. He says there’s no leadership and that the appearance of prosperity is being fed by record amounts of debt. The situation can’t continue on indefinitely and won’t have a happy ending. However, Howard has not lost hope. He believes that the right person will be elected and will help turn it all around. He’s seen it happen before in New York City and he believes that it will happen again in Washington, D.C. Here is a direct audio link.

Posted in Main Page | Comments Off on Howard Davidowitz on the Financial Survival Network

Resistance to debt now widespread

Drug resistance is the name for a reduction in drug effectiveness over time. Perpetual “add debt and stir” monetary prescriptions are no different. Years of over-use have now rendered more debt highly ineffective at treating reduced consumption.

As pointed out by Grant Williams recently, where in the early 1950’s a dollar of increased debt in America multiplied to nearly $5.00 of increased demand in the overall economy, between 2001 and 2012 this effect diminished to some $0.08 of increased GDP for each new dollar of debt.  In other words, increased debt financing has been an inefficient capital trade-off– detracting from future spending–for years.  That future is now here.

Some of this is that an aging population wants less consumer goods. But the balance is due to the paralyzing effects that low savings and ongoing debt payments have after years at zero bound rates and every crazy financing scheme imagined to entice borrowing far beyond healthy limits.

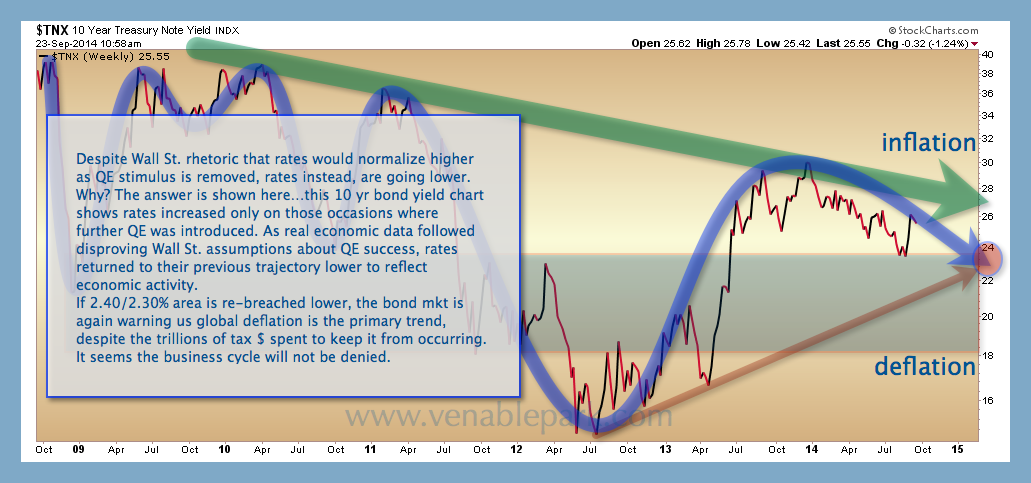
The foreseeable endgame is taking many by surprise and throwing traditional economic theory on its stubborn and foolish head as shown in the chart below  See:  Let there be bubbles for some more excellent context.

Problem is debt chartAging demographics and debt resistance are the main reasons that central banks have lost their once significant force on the global demand throttle.  This updated chart of the US 10 year Treasury yield speaks volumes:  6 years of massive global stimulus and interest rates continue to signal more deflation ahead.

10 year treasury Sept 23 2014

Posted in Main Page | Comments Off on Resistance to debt now widespread

Potential templates for Canadian home prices

We have long been aware that Canadian home prices are among the top 3 most over-valued on the planet along with Australia and New Zealand. (Talking with a friend from New Zealand last week, confirmed that prices on the ground feel just as crazy as the charts and stats we track from afar). The Chinese property markets were also sheer madness over the past few years, but in recent months seem to have started into a much deserved and necessary deflation phase once more.

The common thread in these late blooming bubbles has been lingering optimism from the 2002 to 2008 consumer credit-led commodities boom that burst in 2008, revived on global stimulus in 2009, and then re-burst in 2011 amid massive over-capacity and inventory left by the rampant speculation of the boom. Misunderstanding the nature of these boom-bust investment cycles, Canadian households went full self-destructive mode over the past 3 years, piling on far more debt than anyone should have lent them.

For those who are wondering what the correction phase for still jubilant property valuations could look like: “Like how bad could it be eh?”, other global precedents can offer some guidance. A recent article on the Spanish property market gives a sense of the template that has followed other previously bubbling property values in the world:

“Spanish home prices rose 0.8% in the second quarter compared with a year earlier, the first year-over-year increase since 2008, according to data published earlier this month from Spain’s national statistics institute. The uptick is a sign that prices are stabilizing after falling more than 35% during the last six years.”  See: Squatters welcome Blackstone’s Spanish property play.

An average decline of 35% nationally followed by several years of flat pricing as valuations work lower with debt levels and back in line with wage growth and disposable income is, not only feasible in Canada but, a pattern we have seen many times in the aftermath of previous boom and bust property cycles.

The decline phase doesn’t feel great for those with a lot of property equity. But with little to no debt, price declines are manageable and should be welcome, since mean reversion will bring prices back into the realm of attractive investment. 25 to 35% lower prices will bring rent yields, that have been inadequate of late, up to properly compensate for capital risk once more. Buying low and holding for longer-term income collection will be an attractive investment option.

On the other hand, for those who are highly levered today, such property devaluations are likely to prove bankrupting.

Posted in Main Page | Comments Off on Potential templates for Canadian home prices