Danielle’s weekly market update

Danielle was a guest today on Talk Digital Network with Jim Goddard talking about recent trends in the world economy and markets. You can listen to an audio clip of the segment here.

To clarify the comments on Buffett, investors in his Berkshire shares made zero nominal returns (negative real returns after inflation) for 6 years from 2007 all the way to 2013. Over the past 12 months as QE mania lifted all risky assets, Berkshire shares went along for the ride mirroring the gains in the S&P 500. This also means that when the S&P enters the next bear market decline, the tightly correlated Berkshire will go along for that ride as well. For the chart and more see: Buy and hold Buffett necessarily perpetually bullish.

Posted in Main Page | Comments Off on Danielle’s weekly market update

Stockman: Financial system run aground by “ship of fools”

Notwithstanding the usual heavy gold-mongering by the sponsor, this interview offers some worthwhile macro and financial risk analysis.

The central banks of the world are massively and insouciantly pursuing financial instability. That’s the inherent result of the 68 straight months of zero money market rates that have been forced into the global financial system by the Fed and its confederates at the BOJ, ECB and BOE. ZIRP fuels endless carry trades and the harvesting of every manner of profit spread between negligible “funding” costs and positive yields and returns on a wide spectrum of risk assets.  Here is a direct link to his latest audio interview.

Posted in Main Page | Comments Off on Stockman: Financial system run aground by “ship of fools”

North American treasury yields: how low can they go?

Today the US 10 year treasury has dropped to 2.5%, down from a yield of 3% at the start of the year. If it does close through 2.50 the next downside test area is 2.3% as shown in this updated chart.
10 year treasury July 15 2014

Of course throughout, as usual, stock-floggers have been perpetually forecasting treasury bond prices would tank and 10 year yields soar to 4%+ every moment now. Fascinating that they always see rates moving higher for investment grade bonds (prices lower), but never the commensurate repricing lower that deflation would imply for risk assets like corporate bonds and equities.

But then they are stock-floggers after all, and so hope springs eternal on their asset class and future growth.  Most especially as prices move to all time highs. This next chart of consensus GDP forecasts since the start of every new year since 2009 offers some perspective. The consensus led by the inept US Fed has forecast US GP growth of 3%+ every year only to ratchet it down in retrospect every disappointing quarter. 2014 has been no different (black line below), with expectations from near 3% in January now down to maybe 1.5% half way through.
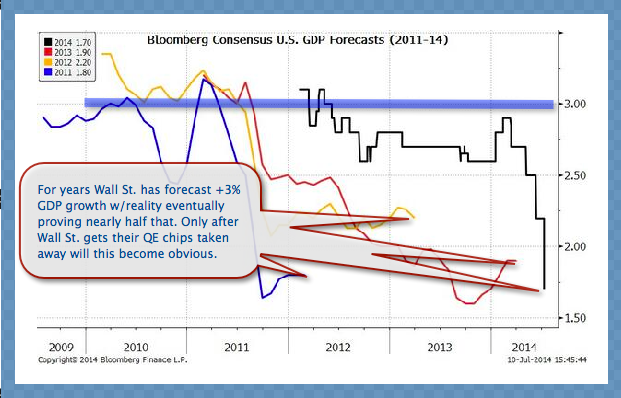
US GDP forecasts 2014
For those who remain mystified as to how North American bonds could be still attracting large buyer interest at present yields, this chart from Hoisington Investment Management, second quarter review and Bloomberg offers a comparative view of present US and Canadian government bond yields relative to the rest of the developed world. So far, North American bonds are offering the highest yields by a significant margin.
Global interest rates June 2014
How low can North American treasury yields go? If the slowing global growth theme continues as we suspect it will over at least the next year or two, the answer is quite a lot lower, with the US 10 year potentially moving back below 2% and the 30 year well below 3.  Believe it or not.

Posted in Main Page | Comments Off on North American treasury yields: how low can they go?