Miraculous corporate profit trend reversing?

We have noted with some amazement and trepidation over the past 4 years as global growth weakened but corporate profits continued to soar thanks to lowered labor costs following the great recession of 2008 as well as low interest rates that fueled one of the longest, largest levered share buy-back streaks in corporate history.

While the earnings show has undoubtedly been one for the history books, the downside is that historically this trend is one of the most reliably mean reverting ever recorded. At some point cash flow, leverage limits and cost cutting can only run so far and then companies need things like sales growth to sustain record earnings growth. The turn is as inevitable as winter after fall, and with stock valuations supremely expectant of more and more earnings gains today, the below chart should give the bulls cause for pause.

Screen Shot 2014-07-02 at 2.40.15 PM
At the same time, another historically relevant gauge of relative value for stocks is total market cap (aggregate $ value of the stock market) divided by annual GDP.   Today the total market cap of the S&P 500 sums to more than 125% of US GDP. This can be compared with the 115% market cap/GDP ratio before the 2008 market collapse and 160% all time high on this ratio before the implosion of 2000-02. Up until 1999, Warren Buffet described this indicator as one of the most useful in assessing when stocks were overvalued and vulnerable to loss cycles. Of course that was before he became the S&P indexing, long-always, cheer-leader for US stocks-at-every-price that he has become over the past 15 years. For those that still do like taking objective measurements of value at risk though, here is the chart.
U.S.-stock-market-cap-to-gdp-6.11.14

Posted in Main Page | Comments Off on Miraculous corporate profit trend reversing?

CAPE ruler still a ruler

Over the years I have commented on the tendency of market commentators to start discounting or ignoring objective rulers when they register bearish measurements. We saw this in 2000 when price to earnings ratios went full nut-job and the long-always crowd started explaining why PE was no longer relevant in the tech era and why EBITDA (Earnings before interest, taxes, depreciation and amortization) was a better value ruler for the brave new world. In 2007 the same thing happened, as the logic was that insatiable Chinese demand meant that traditional gauges of growth and value were no longer applicable. Today, it is belief that zero interest rate policies have left people with nothing to do but to toss their life savings into slot machines with hope that they might hit a jack pot before they go broke (again).

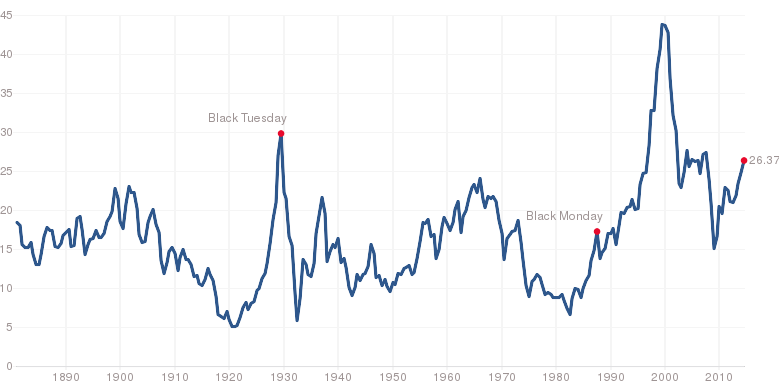
Robert Shiller’s CAPE (average cyclically adjusted price to earnings ratio for the previous 10 years) is one of several objective rulers that have stood the test of time since the 1800’s. Today the CAPE reading is 26.37. As shown in the chart below, the CAPE has only been at this level or higher in 1929, 2000 and 2007, all just before the largest crashes in human history saw broad markets fall between 84% and 55%. Here is the chart.
Shiller CAPE July 2014

With this data in mind now watch this remarkable interview with Bob Shiller as he perfectly articulates the conventional insanity of our times. Here is a direct link to his recent Daily Ticker interview.

Shiller acknowledges that a 26 CAPE today measures 59% above the long-term average of 17 and that he is “definitely concerned…it looks like a peak”. He then goes on to offer today’s conventional bipolar rhetoric that since interest rates are so low people may want to continue holding stocks with some of their savings. But then says, “that doesn’t mean that a high CAPE is not a forecast of bad performance…there could be a massive crash…but maybe stocks should still be in one’s portfolio.”

Suicide bomber anyone? Feelin’ too desperate to think or wait for reasonable odds of success? Be our guest, after you, please, I insist.

A couple of things come to mind in all of this. In recent years, Shiller has developed complex business relationships with Standard and Poor’s via their sponsorship of his “S&P Case-Shiller Home Price Index”. He has learned that sounding constructive on stocks is necessary to maintaining mainstream media coverage and stay in favor with the long-always financial industry. While not throwing out his CAPE ruler all together, Shiller has learned to hedge his comments. Yet if you strip away the “on the other hand” niceties, you hear that risk to savings has rarely ever been as high as today. And never have such extreme valuation peaks resolved themselves without a massive decline of more than 50% that took many years to recover. Other than that, things are good…bonne chance.

Posted in Main Page | Comments Off on CAPE ruler still a ruler

Ingenius homes in unexpected places

A little inspiration about human ingenuity and self-reliance for Canada Day.

In the center of Caracas, Venezuela, stands the 45-story “Tower of David,” an unfinished, abandoned skyscraper. But about eight years ago, people started moving in. Photographer Iwan Baan shows how people build homes in unlikely places, touring us through the family apartments of Torre David, a city on the water in Nigeria, and an underground village in China. Glorious images celebrate humanity’s ability to survive and make a home — anywhere. Here is a direct video link.

Posted in Main Page | Comments Off on Ingenius homes in unexpected places