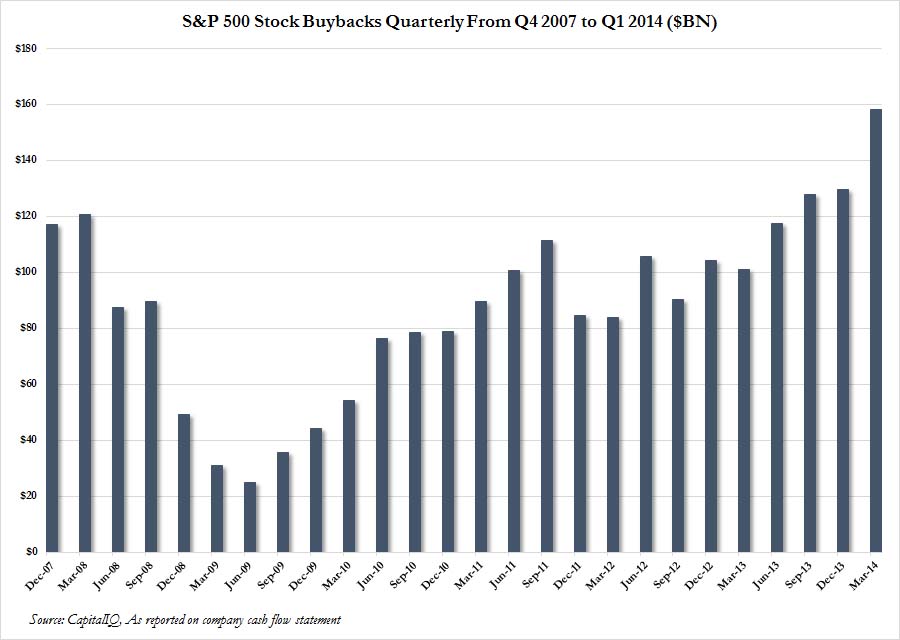
There has been an incestuous circle of influence and selective rewards from Central Bank QE directly into financial markets and the coffers of the fortune 500 executive suite. More and more financial leverage and creative accounting supported abnormal (and historically unsustainable) corporate earnings growth the past few years notwithstanding less and less sales. Companies have borrowed at low rates, not to invest in their business but to buy back their own shares. This in turn has driven share prices to silly levels which has magnified the equity compensation of CEO’s and their boards.
Not surprisingly, management has continually proposed more and more buy-backs, putting short-term gains ahead of long-term investment and business stewardship…quite revolting really. Here’s the chart (notice how little these business wizards were buying back their shares in 2009 when prices had collapsed to the best investment levels in 12 years). Apparently they prefer to buy high!
Longer-term this intense self-enrichment of the few is destabilizing to the businesses, the labor markets, economic strength, democracy and the social fabric as a whole. The c-suite is genius alright. But overall incentives are self-defeating, as the number of consumers who can afford to participate in our consumption led economy weakens by the day. See: Top-paid CEOs get 400% raises for some good historical context.
“CEOs have been quietly (and some not so quietly) ratcheting up higher and higher paychecks throughout the past few decades. From 1978 to 2012, CEO compensation rose 875% — a rise that was “substantially greater than the painfully slow 5.4% growth in a typical workers’ compensation over the same period,” according to a study released last year by the Economic Policy Institute . Furthermore, the CEO-to-worker compensation ratio was 29.0-to-1 in 1978, compared with a whopping 272.9-to-1 in 2012, and CEOs now earn 202.3 times more than than the typical worker, compared with 26.5 times in 1978.
CEOs are even raking in loot at a far faster rate than very highly compensated professionals (those earning more than 99.9% of other wage earners). In the ‘50s, ‘60s and ‘70s, CEOs made 1.62 times more than ultra-high earners, but in 2010 that ratio was 3.08 times more.
Meanwhile, the 99% is struggling — and has been for decades, according to several studies. A report by the Census Bureau found that the real median income of Americans — $51,017 — is virtually unchanged from the late 1970s and early 1980s. And a study by the Economic Policy Institute released last year found that the median worker has seen wage growth of about 5% between 1979 and 2012, even as productivity grew 74.5% over that period. “The wage and benefit growth of the vast majority, including white-collar and blue-collar workers and those with and without a college degree, has stagnated, as the fruits of overall growth have accrued disproportionately to the richest households,” the study authors conclude.”