
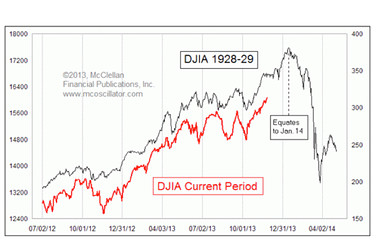
We have no way of knowing for sure how this chapter in monetary history will end. All we know for sure is that today’s market valuations, leverage and fundamental supports are the least attractive we have seen since 2007, 2000, and 1929. We also know that these previous periods of extreme over-valuation resolved themselves with massive price declines for stocks (-50 to -80%) and there are no comparable historical precedents where this did not happen. We also know that Ben Bernanke came to power at the Fed as a scholar of the Great Depression vowing never to repeat what he cited as the monetary errors that preceded it. And then proceeded to roll out the same large asset purchase policies that were used as “stimulus” leading up to the crash of ’29.
“The Bernanke-led Fed’s enthusiasm for avoiding the mistakes that worsened the Great Depression—- a mistimed tightening of monetary conditions — has led him to repeat the mistakes that caused it in the first place: Namely, continuing to lower interest rates via Treasury bond purchases well into an economic expansion and bull market justified by low-to-no inflation… Here’s the kicker: The Fed (mainly the New York Fed under Benjamin Strong) was knee deep in quantitative easing in the late 1920s, expanding the money supply and lowering interest rates via direct bond purchases. Wall Street then, as now, was euphoric.
It ended badly.
Fed policymakers felt like heroes as they violated that central tenant of central banking as outlined in 1873 by Economist editor Walter Bagehot in his famous Lombard Street: That they should lend freely to solvent banks, at a punitive interest rate in exchange for good quality collateral. Central-bank stimulus should only be a stopgap measure used to stem panics, a lender of last resort; not act as a vehicle of economic deliverance via the printing press.
It’s being violated again now as the mistakes of history are repeated once more.” See: Ghost of 1929 crash reappears
For another historically relevant valuation metric, we can view this chart of the Tobin Q ratio since 1900, which is the ratio of the total price of the stock market divided by the replacement cost of all its companies. This ratio is now at a level seen at every speculative market top in the past 113 years but for the blow off peak in 2000.
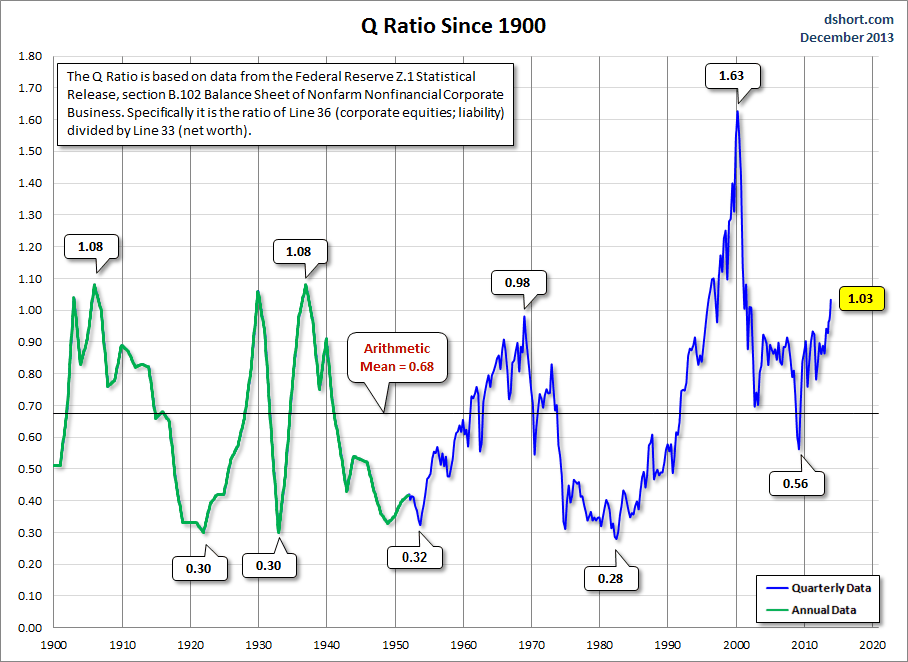
See: The Q ratio and market valuation for more
The dramatic (though fleeting) overshoot into 2000 has caused some to conclude that today could be the equivalent of 1997 and we could see the stock market rally for another couple of years from present levels before prices collapse again. Could be. With conditions this full of distortion and free flowing leverage (so far at least), even crazier prices could happen.
But that said, households, governments and the real economy, are much, much more indebted and fiscally emaciated today than in the late ’90’s. Back then we also had the legitimate revolution of the internet driving animal spirits. Today we have just hope that more debt and even more monetary liquidity will change the world…









