New wave of loan losses hitting at a bad time for banks

“A new wave of problems could be approaching the mortgage industry. U.S. borrowers are increasingly missing payments on home equity lines of credit they took out during the housing bubble, and that could be another hit for the banks.” Here is a direct video link.

Given the advent of new regulation reducing profits from some of their criminal and unethical practices as well as the rash of litigation and record fines they have been dolling out for securities violations of late, another wave of loan losses will be hitting banks at a difficult time.

Posted in Main Page | Comments Off on New wave of loan losses hitting at a bad time for banks

Big black holes in the bullish case

Bubble television is rolling out all the usual bull artifacts to justify why stocks keep going up: Abbey Joseph Cohen (Ms. tech stocks for the long-run of 1999 and commodity stocks for the long run of 2008) and Warren Buffet (now Mr. S&P 500 closet indexer, see: Buffett’s return-free-risk round trip) et al. But for those that prefer rational gauges and a reasonable shot at protecting and growing their savings over time, there are glaring holes “in the stocks are attractively priced” story today.

The historically reliable Shiller PE (price/10 year average real earnings) is today at 25, giving US stocks in 2013 the distinction of being the most notoriously priced since the Tech bubble peak of 2000 (where it was 44) and the leverage bubble peak of 1929(where it was 32) as compared with Shiller PE’s between 5 and 8 in secular bottom lows in 1921, 1932, 1942 and 1982. See this chart for a big picture view.
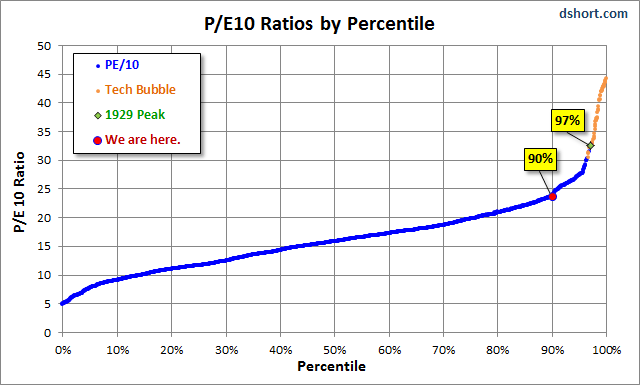
Analysts (at least any that are sentient) know perfectly well that the Shiller PE at 25 suggests that at present values stocks are priced to earn negative returns over the next 7-10 years. But since they need to sell stock investing to the public at every price they reach for different ways to parcel valuation data. One quick fix tool is to divide the current S&P index price by its “trailing 12 month earnings” (TTM). On this measure the current S&P price to TTM clocks in at 18.6 compared with a historic average since 1870 of 15 and a reading of 6ish at secular bear lows on this metric in 1920, 1950 and 1980.

Not to be put off, bullish analysts next stoop for that infamously delusional indicator: the Price/forward 12 month estimated earnings ratio. This one is a particular laughing stock for a few reasons. First of all sell side analysts are well documented to be horribly over-optimistic at forecasting earnings. They literally place a ruler under last quarter’s earnings trend and draw a straight line up. In this way they have over-estimated earnings growth every single quarter except at recession bottoms where they finally flip their ruler down and turn bearish just as momentum finally turns up. As a recent example, analyst consensus was expecting S&P earnings growth of 10% in the 3rd quarter of 2013, and the actual growth came in at just 4%. In any event, their current consensus estimate for 12 month forward S&P earnings is an all time high $119.30 which at 1803 for the S&P works out to a P/E forward ratio of 15.11 which they argue is only average not expensive.

But as John Hussman explains so well this week in An Open Letter to the FOMC, using forward-extrapolating-rules-of-thumb for earnings estimates is particularly dangerous today because of a spate of unusual phenomenon the past 4 years (wage reduction and labor suppression out of the great recession, productivity increases and stock buybacks rather than fixed investment) which have led to the highest ever recorded corporate profits as a percentage of GDP ever, as graphed in this chart:
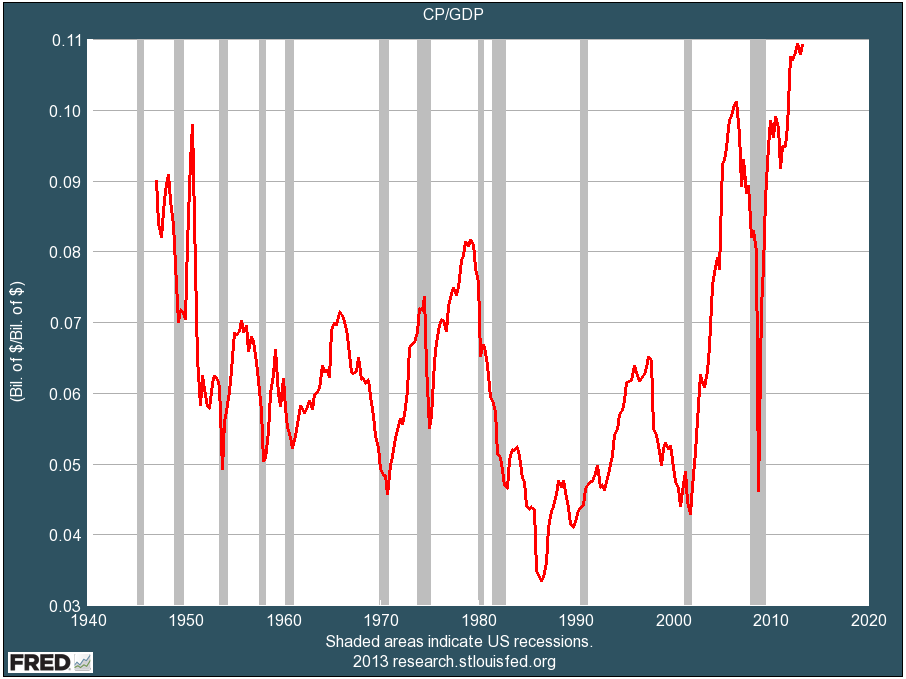
The historical mean for corporate profits after tax is 6% of GDP. Today this ratio sits 70% above average at more than 10%. So those forecasting higher corporate earnings from here are assuming that this time is different and corporations can only make more and more while governments and households earn and have less and less. They assert that this time trees profits will grow to the sky.

Based on historical mean reversion patterns though, present outsized profits would need to contract by more than 15% a year over the next 4 years to restore their long-term equilibrium with economic growth. We will then see just how “attractive” today’s record high equity prices will measure by then.

Posted in Main Page | Comments Off on Big black holes in the bullish case

Comprehending history

My daughter was studying for a history test on the 1920’s this weekend, last night we watched this documentary together. I had not seen this one before. Can’t help but recognize familiar themes with recent trends in financial markets. One notable difference is that in 1929 the FOMC was warning that margin abuse and an over-valued stock market were dangerous for the real economy. Today the Bernanke/Yellen Fed point proudly to the overbought stock market as proof of all their good work. Here is a direct video link.

One of the most infamous and relentless modern day Perma-bulls, Jeremy Siegel is featured on CNBC this morning pronouncing US stocks as fairly priced with US markets at all time nominal highs–now up 32% over the past 12 months–even as corporate revenue and earnings continue to plunge. Of course after writing his signature book “Stocks for the Long Run” at the peak of the secular bull in 1999, Siegel has been trying to justify and defend his devastating record ever since. In his book preface, he thanks the sell side brokerage firms for all their financial support and patronage in furthering his writing and speaking career. And the sell side loves him to be sure.

Here was Siegel in 2008 offering his usual jubilant take see2008 economic and market forecast:

“I believe the stock market will do better in 2008 than it did in 2007, when it chalked up a 5.5% return, the fifth year in a row that the market went up. Year-ahead forecasts for the stock market are notoriously difficult, but I believe that a 10% to 12% gain is possible, on the heels of a recovering financial sector. Financial stocks plummeted almost 20% last year, and this was the reason why the market had a mediocre year. Outside of financials, the S&P 500 Index had double-digit returns. A revival of financial stocks would spur good market gains this year.”

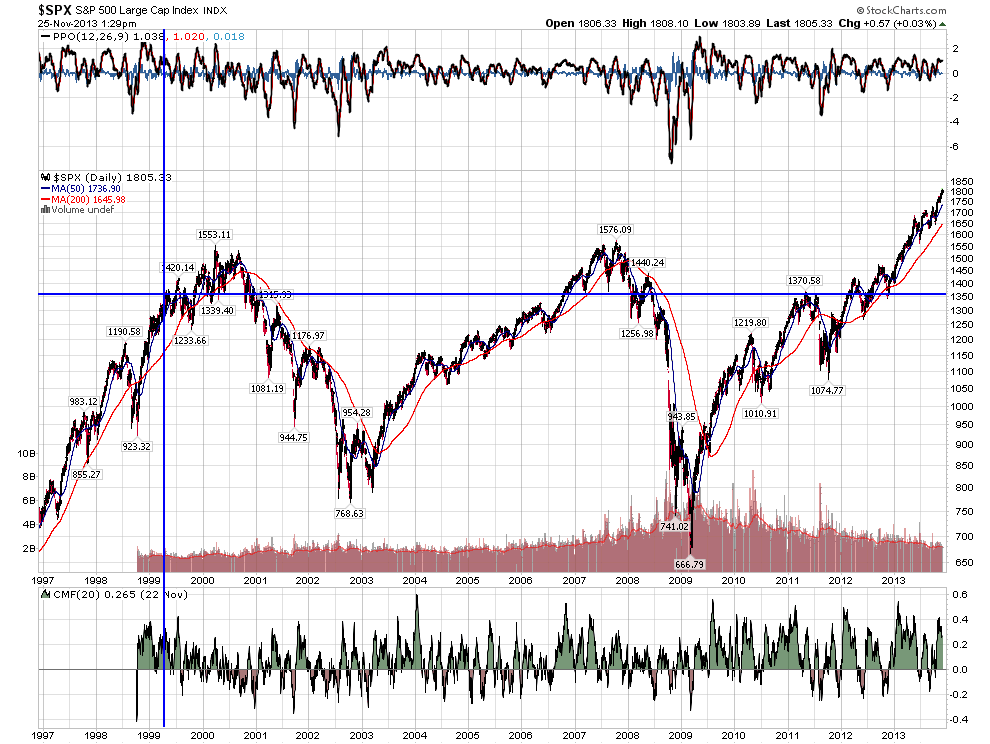
A little math worth appreciating here: since the last cyclical bear ended in March 2009, US stocks have rallied 170% –59% of that just over the past 24 months on Q’ever promises from the US Fed. Before the QE gift of the past 12 months, which has emboldened so many Perma-bulls to think they are genius once more, the S&P had gained just an average of 1.67% year between 2000 and 2012. Even including the past year’s magical ramp, the S&P has now averaged just 3.2% a year (before any fees) since the secular began in 2000 on the launch of Siegel’s reckless book. (The Canadian stock market has gained even less (1.22%/year),being today still some 12% lower than its June 2008 peak). So stocks have averaged less than cash and bonds for 14 years with heart-stopping volatility that has included two 50% drops.

Most important of all and what no bull wishes to acknowledge: it will now only require an average little run of the mill bear market decline of -25% from here to wipe out all of the S&P’s price gains since 1999. Genius? Welcome to our secular bear.

Posted in Main Page | Comments Off on Comprehending history





