Lakshman Achuthan, COO and Co-Founder of Ecri, reaffirms the U.S. is in recession and offers further explanation of his call. Here is a direct video link to part 1.
Here is a direct video link to part 2.
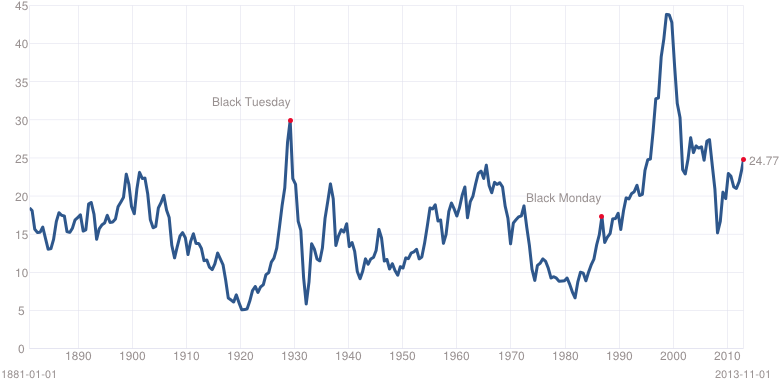
As Achuthan mentions, other than the past year, there have been three times in history when the stock market did not contract during an economic recession, one was during the 1945 recession–followed by a downturn in 1946, and another during 1980–followed by back to back recessions into 1982. An important distinction in both of these comparables though, is that coming into both economic recessions stock valuations were already near secular lows having been ground continually lower through lengthy secular bear periods (1929-1943) and (1966 to 1982). These secular lows in valuations are quite clear in the long term Shiller PE chart shown here since 1880.
See ECRI’s full report examining and comparing these periods here: The US business cycle in the context of the yoyo years.
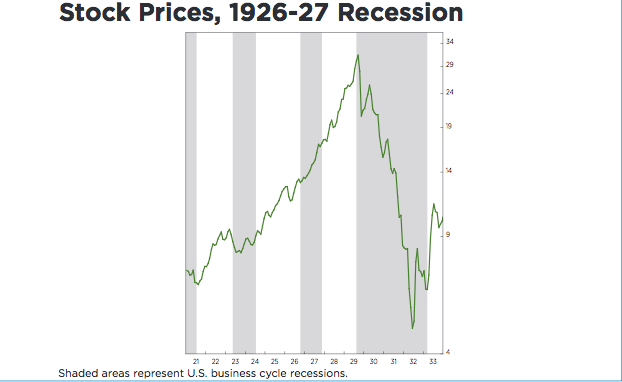
But it is the third incidence cited, during the 1926-’27 recession, which measures as most historically similar to the present market cycle. Then as now, stocks were levitating at the high end of historic valuations late in a massive speculative cycle which allowed prices to defy the reality of the downturn in the real economy–at least for a couple of years–before succumbing to the 80% collapse in 1929 and a secular bear market that then persisted all the way to 1942 as stock bulls were devastated for their preceding foolishness. Here is ECRI’s chart of the 1926 to 1929 market experience which we suspect is most relevant to present market risks.
Sure but other than that…what’s not to love about the play Mrs. Lincoln?