With fiscal drag (not stimulus) in 2013, and no new monetary magic planned, the economic growth forecast by many over the next 12-24 months is dependent on a hand off to the real economy. But without wage growth to support greater consumer spending, and without increased consumer demand to support business investment, the next runner to grab the economic baton is not evident.
CNBC’s Rick Santelli reports the latest retail numbers were near expectations, while the import-export data was a little light. Here is a direct video link.
Posted inMain Page|Comments Off on Retail sales soft, but not bad enough to take taper off the table
China’s economy has become the second largest in the world, but its rapid growth may have created the largest housing bubble in history. Here is a direct video link.
During the global consumer credit bubble from 2002-2007, China received an unprecedented surge of cash flow from our “dumb” consumer levered-spending across the developed world. What did they do with all that suddenly found wealth? What most humans do in such circumstances: they made a bunch of bad and unproductive spending choices. In 2008 when the cash flow bubble from exports finally burst, the Chinese government responded with more bad decisions, levering up to try and reignite hyper-growth in the economy. Now 5 years later, western cash flow has not come back, and the Chinese economy is slumping neck deep in a domestic debt bubble of its own making. While it was the country that rolled out the relatively largest stimulus package during the 2008 Great recession, China is not now able to rescue the global economy in the next leg of the post-credit bubble recession.
Posted inMain Page|Comments Off on 60 Minutes looks at China’s real estate bubble
The market is showing signs of weakness, and similarities to previous market tumbles. Here is a direct video link.
The first half of this clip is useful for its historical context. The latter half is the usual financial-tainment where hosts pose as savvy traders in an effort to keep viewers watching.
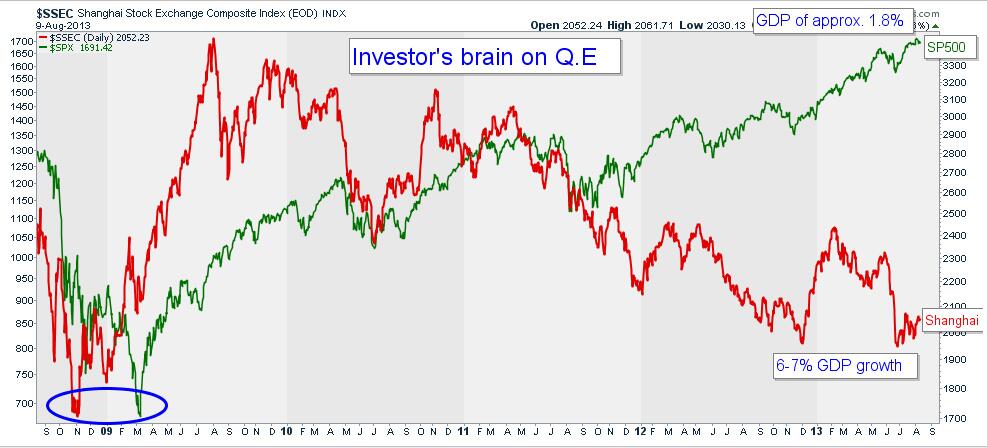
The below chart offers further useful perspective in its comparison of the S&P 500 and the Shanghai composite since 2008.
Source: Cory Venable, CMT, Venable Park Investment Counsel Inc.
Recall that these two exchanges represent the world’s two largest economies: China and the US. And that stock markets have traditionally moved as a leading indicator for economic growth. Here we can see that as Chinese GDP growth rebounded ahead of the global economy out of the 2009 recession into early 2010, the Shanghai composite led the way rebounding 109% (after falling 73% from November 2007 when the Shanghai topped at 6124 to November 2008 when it bottomed at 1664). Since late 2010 however, the Shanghai composite has fallen a further 36% in a fresh cycle downturn with the global economy.
At the same time, the S&P 500 has decoupled from the downturns in both emerging markets and global growth to soar into a world all of its own. US growth has slumped from a peak of about 4% in the fourth quarter of 2011 to barely over 1% over the past 3 quarters and still US indices have defied contracting global demand and stagnating revenue and profits among their constituent companies. In fact, apart from QE-supported financial firms, earnings growth is actually now negative for all the other S&P 500 sectors coming into Q3. The warning signs for capital have rarely been flashing brighter, and yet “experts” who will say they are bearish on US stocks today are nearly extinct. Classic.
Posted inMain Page|Comments Off on Ominous precedents to present market cycle
“An explosive critique about the investment industry: provocative and well worth reading.”
Financial Post
“Juggling Dynamite, #1 pick for best new books about money and markets.”
Money Sense
“Park manages to not only explain finances well for the average person, she also manages to entertain and educate while cutting through the clutter of information she knows every investor faces.”
Toronto Sun