This morning’s shocker: US Q4 GDP contracted. It turns out that the US is not an island on its own and is not decoupling from the global downturn which accelerated in most economies in 2012.
But not to worry, no doubt the consensus view that has been declaring great value in US stocks at 5 year highs, will be quick to dismiss this as an anomaly, rather than a trend. Stand by.
For those who don’t like to lose money, the Case-Shiller housing index offers some valuable insight on the way in which asset bubbles historically move. Here is a chart that includes the most recent data on the 20 city composite of home prices released yesterday.
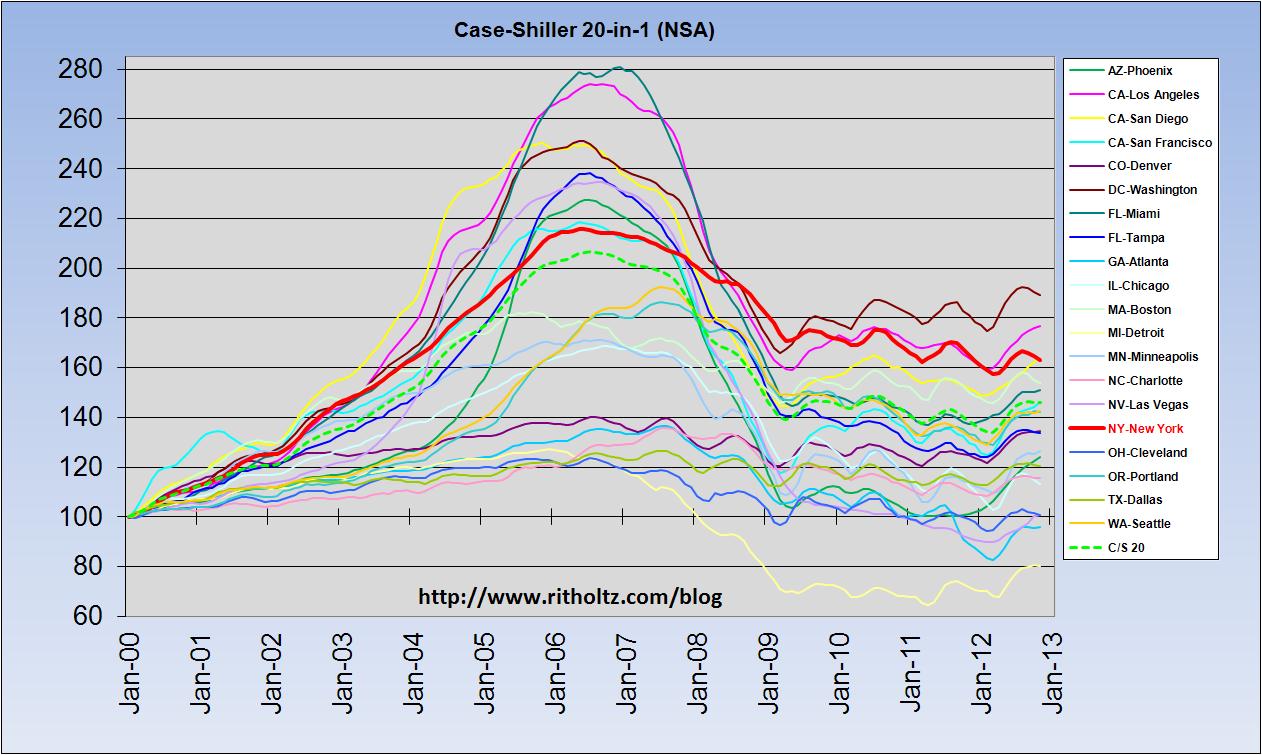
Note the parabolic shape of prices into the bubble peak in 2006, followed by the collapse and then sideways action ever since as market forces battle to reprice and absorb excess inventory into the pool of able and willing buyers.
In fact this pattern is typical of financial bubbles and their aftermath. The secular bear periods that follow a valuation bubble take an average of 17 years to grind out the bubble excesses and finally present exceptional investment value. We saw a similar pattern in stock markets after 1929 and pretty much every other secular bear period that followed every secular market top in history. This includes most recent examples of Japanese real estate and stocks since 1989, and technology stocks since 1999. In 2000, broad stock markets also began the necessary process down from their bubble peak. But over the past couple of years, this natural correcting process have been stalled in a detour of government bailouts that have temporarily supported insolvent institutions and by central banks tinkering in experiments of monetary theory. 13 years into the present secular bear in stocks we see historically familiar trends playing out in Chinese stock prices as well as commodity and resource shares since they peaked with the credit bubble in 2008. Combined on one chart, we can also get a sense of the dramatic price risk now teetering over unsuspecting crowds in overbought US stock markets.
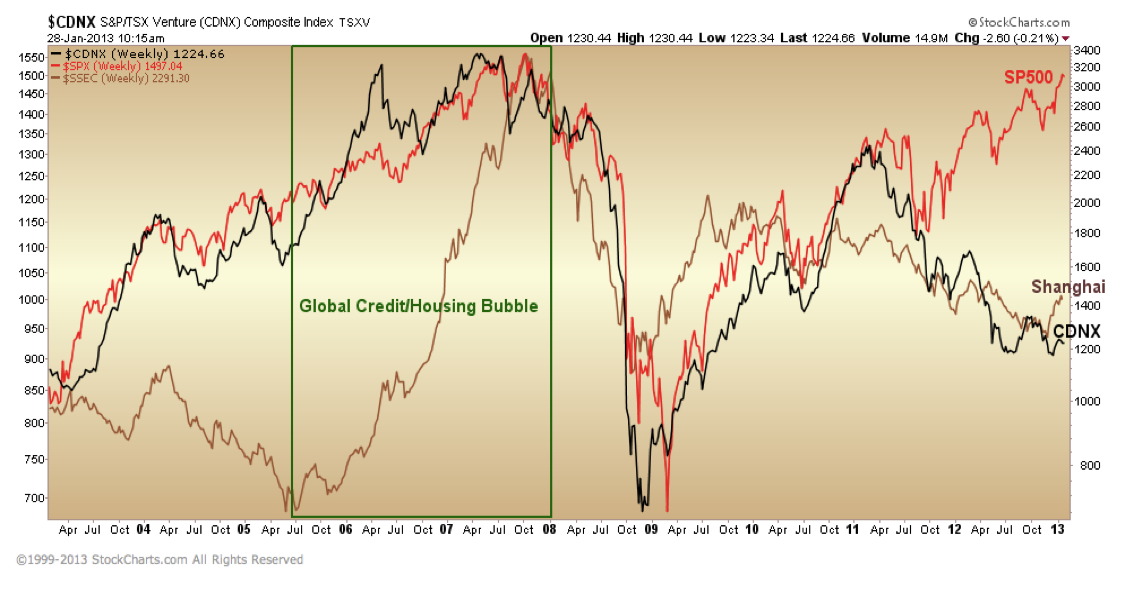
Source: Cory Venable, CMT, Venable Park Investment Counsel Inc.

 My son and his friend have undertaken a grade 8 project to help educate students about the dangers of debt. One of their goals is to garner public support for adding the study of debt bubbles and credit education to high school curriculum. Since “every generation’s memory tends to be as long as its own experience”, I can’t think of a better topic to teach young people–the earlier the better.