Update on political and economic risks in 2013

Nouriel Roubini, co-founder of Roubini Global Economics LLC, and Ian Bremmer, president of Eurasia Group, talk about the European debt crisis, U.S. fiscal policy and political tensions in North Africa. Tom Keene is obnoxious in his perpetual push for “happy” news, and his habit of cutting off sober thoughts to divert to nonsense, but the content from Roubini and Bremmer is worthwhile. Listen to the remarkable sugar-high-like-speed with which they are forced to espouse complex thoughts in this ‘bits and bites style’ segment. SNL should do a comedy skit on the typical business television interview pace today. It’s truly ridiculous. Here is a direct link.

Posted in Main Page | Leave a comment

Portrait of the fiscal cliff

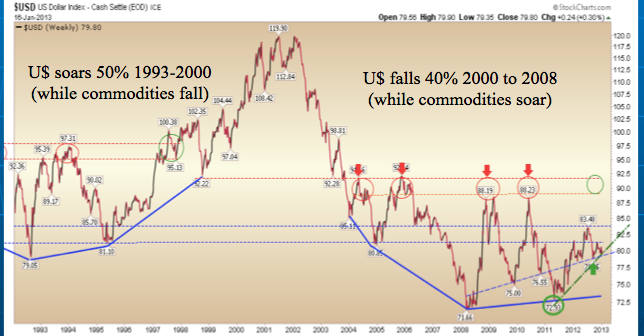
I included this chart of the US dollar index against a basket of global currencies in a presentation I did in Vancouver on the weekend. It helps put some big picture perspective on the US dollar and how its movements as the benchmark currency have impacted asset prices over the past 20 years.
Source: Cory Venable, CMT, Venable Park Investment Counsel Inc.

First of all, we can see the surge in strength during the 1990’s tech bubble where the US could do no wrong and the world fell in love with their technological innovation in computers and the internet. The US dollar strengthened 50% during this period peaking with global stock markets in 2000. During this period, commodities were under-loved, under-invested, and under-priced (given their inverse price moves to the Greenback). After the tech bubble burst, people came to experience the financial trauma of their over-optimism, and over-investment began to flow back out of US dollars. Then came the 2001 downturn and the Greenspan led Fed began its epic and misguided efforts to re-inflate risk appetite by slashing interest rates from 5.5% to 1% by 2002. Next came 9/11 and the Bush administration opted to slash tax rates and commit to 2 massive military initiatives in Iraq and then Afghanistan while at the same time increasing spending in other areas. This was the real fiscal cliff, when spending went parabolic while tax revenues plummeted thanks to the weaker economy and lower tax collection. These were also the catalysts which drove the over-valued US dollar from its over-exuberant peak in 2000 through a 40% decline by 2008. Not surprisingly, commodities soared through this period, as prices moved from deeply under-valued in 2000 to deeply over-valued by 2008.

As the US dollar bounced off the depths of negative sentiment in 2008, over-valued stock and commodity prices tanked in sequence. Waves of government and Central Bank stimulus managed to force a cyclical bounce for risk markets from 2009 to 2011, and then the US dollar turned back up just as very few people expected it.

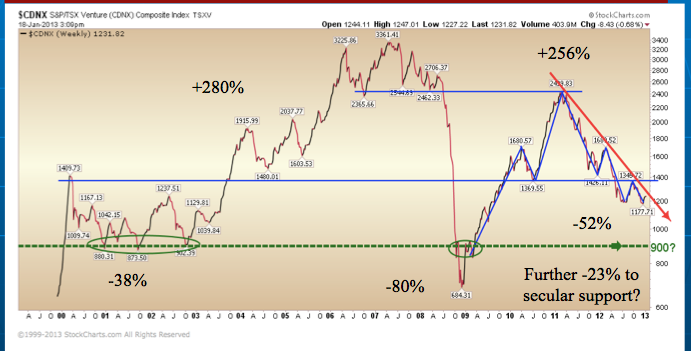
The precious metals and commodities crowd that had been decimated in 2008 found renewed hope in the speculative resurgence in liquidity fueled trading and stockpiling into 2011. They naturally believed they had been given reprieve and went back to over-confident bets just as the world economy turned back down. Since then the resource and mining sector has been hammered afresh as captured in this next chart of the Canadian Venture Exchange.
Source: Cory Venable, CMT, Venable Park Investment Counsel Inc.

Now down some 63% from the 2008 bubble and some 50% from the 2011 rebound, the good news is that the resource sector has been through a large correction and while a further 20%+ downside is needed to retest its secular support, the space is surely moving closer to reasonable value now than it was in recent peaks. The bad news, is that as in other bubble aftermaths, it is likely that some 70%+ of companies in the sector are likely to go out of business and disappear in one way and another over the next couple of years. Investment success as always, will depend on one’s ability to determine who will be left standing and what price to pay for the new lower growth environment. As massive, reckless leverage continues to move out of this sector, investors may well do best to let the players settle a little further before stepping in.

Posted in Main Page | Leave a comment

The downside of over-priced

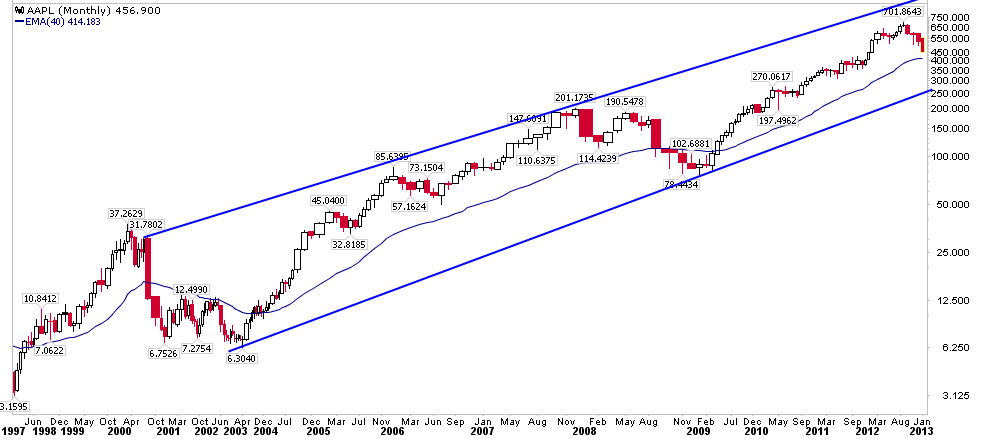
Apple making news this morning on lower earnings growth and the weakest sales increase in 14 quarters. The share price that was $700 in September 2012, is today at $454 for a decline of 35% in 3 short months. The below monthly chart in log scale captures the channel Apple has traded in since the tech wreck in 2000. What is notable are the repeated swings from the top of the channel to the bottom as consensus expectations move from classic over-optimism to over-pessimism.

Source: Cory Venable, CMT, Venable Park Investment Counsel Inc.

In 2000, Apple moved through a 83% decline from a $37.26 peak down to $6.30.
In 2007, a 61% decline from a $201.17 peak to $78.44.
In 2013? From the $701.86 peak down to a channel low would take the stock back to approx $275 for another 61% decline.

It will be interesting to see what happens this time. The price experience will also undoubtedly impact broader market sentiment, keeping in mind that outsized gains in Apple made it the largest market cap company in the world over the past 5 years as the company came to represent a disproportionately large overweight of the total S&P earnings growth.

In reality the positive “Apple effect” over the past 3 years managed to gloss over weakness in many other sectors and companies that have continued to struggle in the now post-consumer-credit bubble environment. As calculated by Ned Davis Research in 2012, without Apple’s extraordinary (and naturally unsustainable) earnings growth many broader markets look vulnerable as they flirt with prior cycle highs. S&P 500 total earnings growth as an example, drops from 7.8 per cent year over year with Apple in 2012, to just 2.7 per cent without it.

Apple’s latest price plunge comes predictably, just as Hedge funds and trend following asset managers reported Apple as their top holding at the end of 2012. The typical mindless commentary is plentiful in response. Aren’t Apple’s products still visionary? Is is because Steve Jobs is gone? Why has Apple suddenly lost its Mojo? The answer is relatively simple: Apple shares were destined to correct sharply because its shares were heavily over-bought and over-held by a perpetually expectant group of momentum following analysts and managers. This is a human herd who always becomes increasingly optimistic as stock prices rise and increasingly pessimistic as stock prices fall. This is the precise opposite of what investors must do if they hope to retain and carefully grow their capital over time. A fool and their money will always be easily parted. And those with cash, patience and discipline will continue to experience remarkable advantage across full business cycles.

Posted in Main Page | 8 Comments