Higher rates freezing mobility and consumption

About seventy percent of Canadian mortgages were taken out over the last few years with a 5-year fixed term and an ultra-low interest rate that averaged 2.79%. In 2020-2021, some 40% were taken at floating rates that averaged 1.65%. Floating and new fixed-term rates are now above 6%. Eighty-five percent of US home mortgages have a 30-year fixed-term taken out when rates were less than 4% versus new term rates above 7%.

Refinancing/equity withdrawals and moving are off the table for the masses since most can’t qualify for new loans at current rates. No wonder that new mortgage applications are the lowest since 1995. See Mortgage Growth Buckles Under Weight of Rate Hikes in Canada.

The housing market is frozen as the number of people reporting it is a good time to buy a home slipped to lows seen just twice since 1960—the recessions of 1973-74 and 1981.

The trouble is that life happens and staying put is not always possible. As layoffs pick up, more people will want to move to downsize expenses or relocate for new employment.

David reviews the lagged impacts of higher rates well in the segment below.

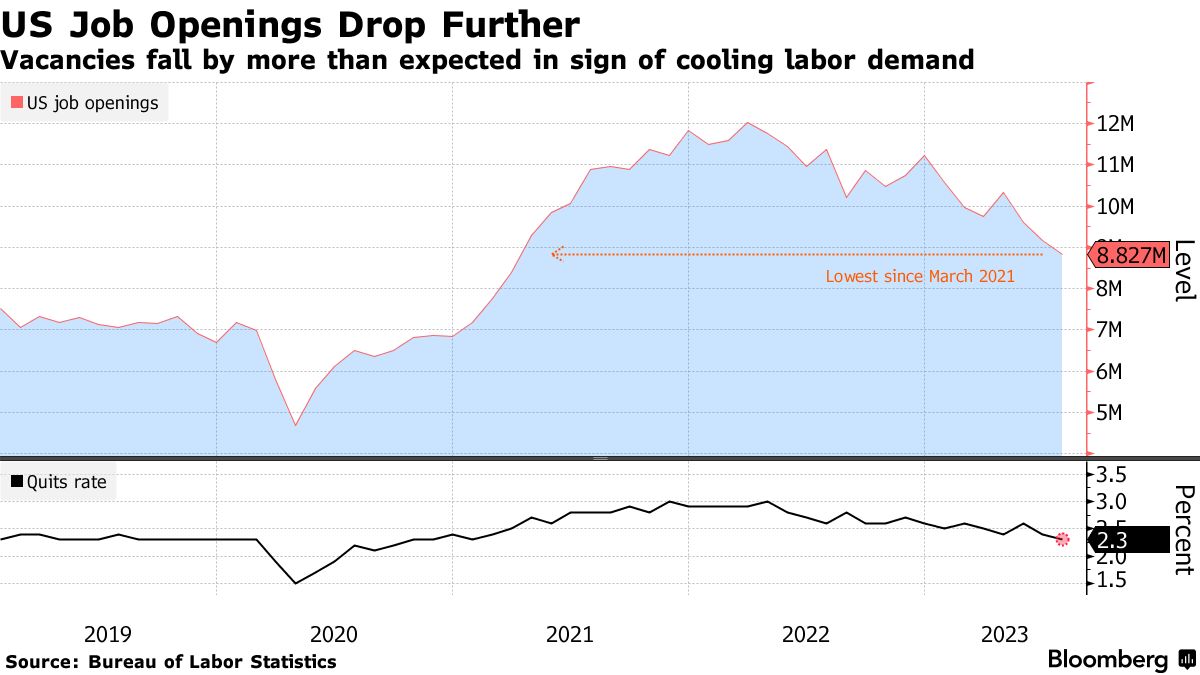
David Rosenberg, Rosenberg Research, joins ‘Fast Money’ to talk about the U.S. economy, the impact of interest rates, slowing employment growth and more. Here is a direct video link.

Posted in Main Page | Comments Off on Higher rates freezing mobility and consumption

Unaffordable prices cure unaffordable prices

Canada’s housing bubble is crystal clear unless you are paid not to see it (wilfully blind) or painfully naive.

The average national home price of 754K in July is ten times the average household income of $75k. The historically recognized affordability ratio has been home prices that are 3 to 4 times household income; this ratio allows people to pay off their shelter within 25 years and still have some cash flow available for other spending and saving needs. In provinces like Ontario and BC, where the average household income is higher, the average home price is likewise, so affordability is worse. See the table below and more here.

Some seventy-seven percent of Canadian homeowners have a mortgage, and seventy percent were taken out in the last few years with terms coming up for renewal in the next 1 to 5 years. It requires a household income of about $180k (with no other debt) to qualify for a mortgage to purchase or refinance the average Canadian home today. Ninety percent of Canadian households have incomes less than the required 180k.

Historical precedents have ended in multi-year busts where prices tumble greater than 20 percent nationally and more in the most inflated areas.

Lenders, investors and homeowners take losses, bankruptcies spike, and those who are ready buy real estate and related securities at the best valuations in decades from desperate sellers who had leveraged up when prices were high.

It’s important to understand that interest rates do not need to go higher for housing prices to keep falling. The extremity of pricing and leverage in the system has already cast the corrective die. Like driving 200 miles per hour, any wobble or unexpected development is enough to trigger wipeouts.

From a 52-year low last summer of 4.9%, Canada’s official unemployment rate has risen to 5.5% compared with the long-term average unemployment rate of 8%. Job loss will increase over the next year and possibly beyond. The good news is that unaffordable prices are the cure for unaffordable prices. It’s not a question of if, just how long it takes.

Analyst Phillip Colmar delivers wildly unpopular facts well in the segment below. Hate mail is sure to follow.

MRB Partners’ Phillip Colmar explains why he thinks Canada’s real estate market is in a huge housing bubble and what key factors could cause it to pop. Here is a direct video link.

Posted in Main Page | Comments Off on Unaffordable prices cure unaffordable prices

Economic weakness leads unemployment, not the other way around

Many cite US and Canadian unemployment levels today near 5o-year lows as grounds for economic optimism. Unemployment is a lagging indicator that commonly inspires misplaced confidence heading into recessions and then pessimism as it rises into subsequent economic expansions.

For leading employment indicators, we look to readings on the average manufacturing workweek, average overtime manufacturing hours, initial jobless claims and the ratio of voluntary to involuntary part-time labour (the part-time ratio). All have reflected a weakening job market in recent months.

Today, we learned that US job openings fell in July by more than expected to a two-year plus low, and over the past three months, by the most on record. Moreover, the job quit rate fell to the lowest since January 2021 as workers report growing pessimism about their employment prospects. See, US Jobs Openings Decline to Lowest since early 2021.

Hires declined to the lowest level since January 2021 and have dropped by 458,000 over the last two months, the largest decrease since the end of 2020.

It bears noting that the stock market has never bottomed before the Fed pauses its tightening efforts and only after interest rates have been falling with economic output and employment for many months. The longest Fed pause between the last rate hike and the first cut was 15 months (July 2006 to September 2007), and the average was eight months. In every case since 1969, recessions began at or shortly after the first rate cut, with the stock market bottoming 13 to 33 months after the last Fed hike.

Moreover, when we enter economic downturns at historically low unemployment rates (like today), central banks have been slower to start easing again than when unemployment rates are relatively higher. Hence, the next easing cycle is likely farther away than many hope.

Maybe July was the last rate hike this cycle, or perhaps it will be in September or November. In any case, the case for capital protection today is extraordinary.

Posted in Main Page | Comments Off on Economic weakness leads unemployment, not the other way around