Some black clouds for the global economy are billowing in China today while most are distracted by ongoing antics in Europe. Some reminders courtesy of Ambrose Evans-Pritchard this morning (thanks Victor):
-The Shanghai index has fallen 30% since May and is now down 60% from its peak in 2008. (nearly as much in real terms as the Dow fell from 1929 to 1933).
-The country’s Homelink property website reports that new home prices in Beijing fell 35% in one month from October to November.
In addition this morning we learned that Chinese manufacturing activity extended its decline in December for a second month, with lower production at factories and a drop in the volume of new orders, HSBC’s so-called “flash” Purchasing Managers’ Index printed at 49, once again below the threshold of 50 that separates expansion and contraction
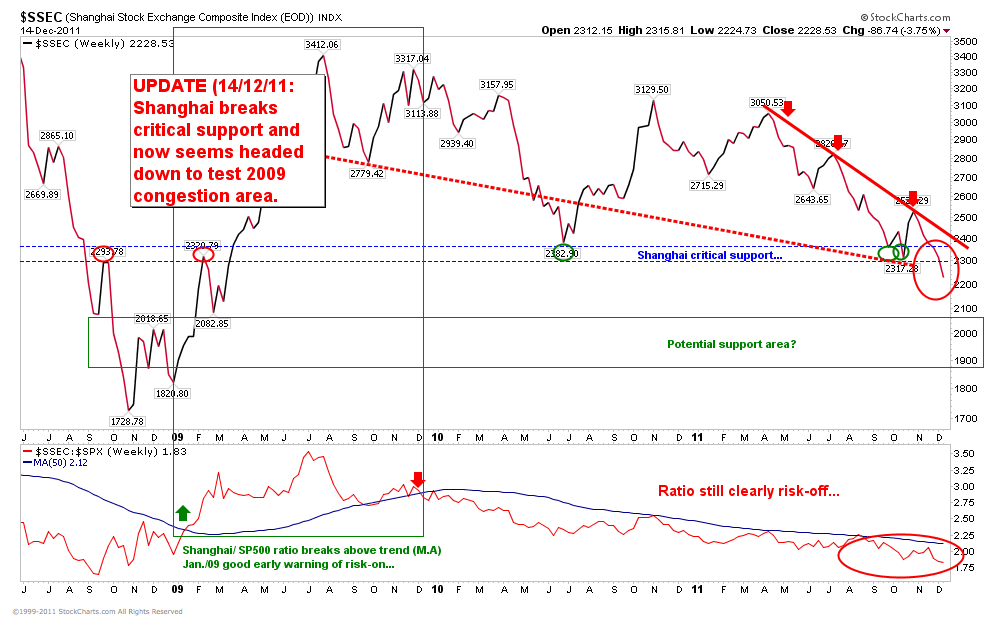
Here is the big picture update of the Shanghai composite which is now well below the critical support (blue dotted line) we had previously outlined. This chart was up to Dec 14 and today the Shanghai is down another 2% to the 2180 range. The next target range is a test of the prior cycle low (2008-2009). During the last bear market, Chinese stocks led and bottomed some 4 months ahead North American markets. Watching the replay here is fascinating and yet not surprising, considering the global credit bubble that benefited China so much in the run up to 2007 continues to hurt demand for their goods as we run to the end of government-liquidity-pumping once more. The message for global stock investors is clear: step aside or lose more capital.
 Source: Cory Venable, CMT, Venable Park Investment Counsel Inc.
 Source: