GMO co-founder Jeremy Grantham’s latest market letter is worth the read as usual; see After a timeout, back to the meat grinder! On equities, Grantham’s base case is that the S&P 500 could fall a further 20% by year-end, for a total real decline of 40% since 2022.
My calculations of trendline value of the S&P 500, adjusted upwards for trendline growth and for expected inflation, is about 3200 by the end of 2023. I believe it is likely (3 to 1) to reach that trend and spend at least some time below it this year or next. Not the end of the world but compared to the Goldilocks pattern of the last 20 years, pretty brutal. And several other strategists now have similar numbers. To spell it out, 3200 would be a decline of just 16.7% for 2023 and with 4% inflation assumed for the year would total a 20% real decline for 2023 – or 40% real from the beginning of 2022. A modest overrun past 3200 would take this entire decline to, say, 45% to 50%, a little less bad than the usual decline of 50% or more from previous similarly extreme levels.
In the near term, Grantham acknowledges that traditional strength during year three of the US Presidential cycle could help risk assets rally into April. His chart below shows that a disproportionate amount of all stock market gains since 1932 have occurred during the seven months from October through April of year three of a US President’s 4-year term.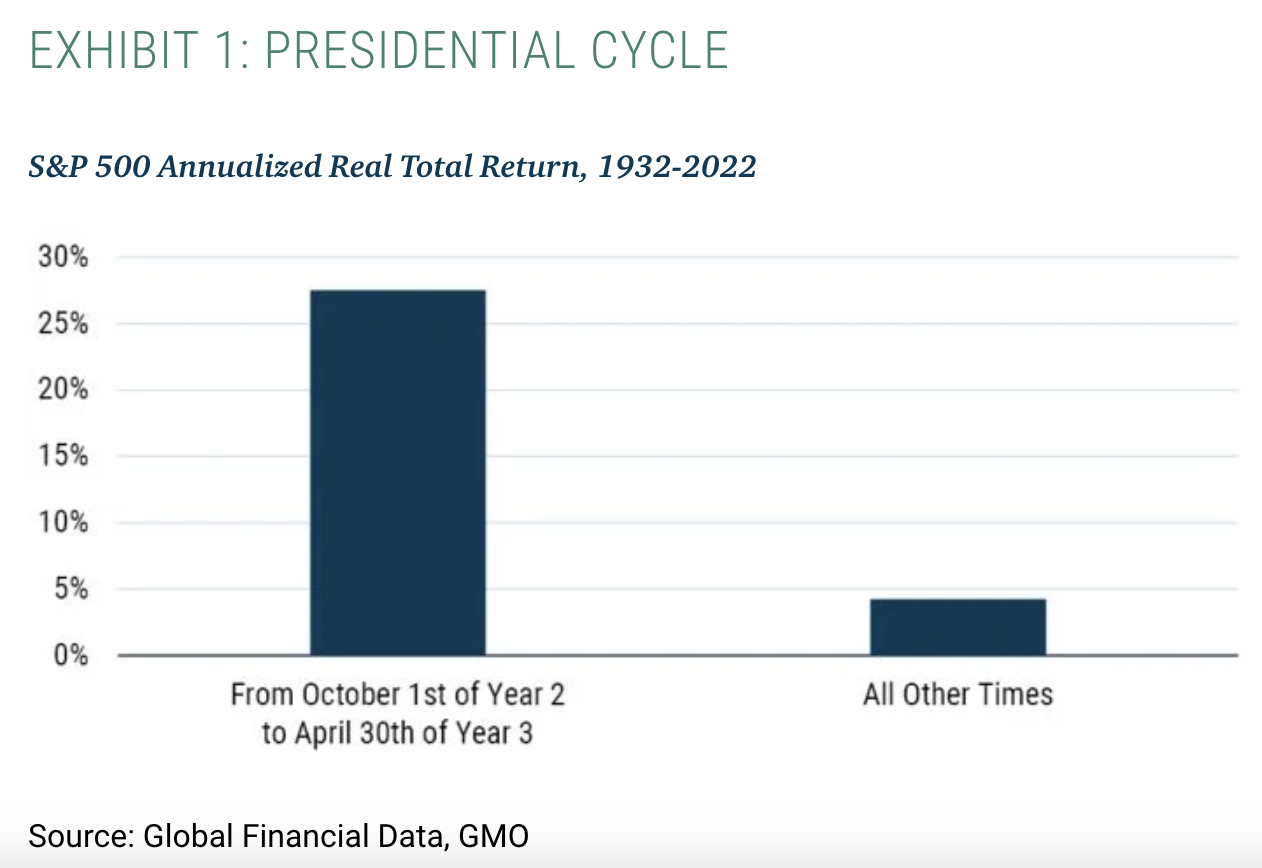 Nothing is certain in markets, but Grantham explains the statistical significance:
Now for timing. There are some complicating factors that seem quite likely to drag this bear market out. Let’s start with that irritating factor, the Presidential Cycle, so simple sounding that no one in the fee charging business can afford to be associated with it. And that is presumably why it continues to work. The important fact here – see Exhibit 1 – is that for 7 months of the Presidential Cycle, from October 1st of the second year (this cycle, 2022) through April 30th of the third year (2023), the returns, since 1932, equal those of the remaining 41 months of the cycle! This has a less than one-in-a-million probability of occurring by chance, pretty remarkably, and it has been about as powerful in the last 45 years as the previous 45 years. We are now in this sweet spot, which once again is up nicely so far. The logic and nuances are spelled out in Appendix 1. Suffice it to say that this positive influence may help to support the market for a few more months.


