Hoisington Q4 2022 Review and Outlook

Hoisington Management’s fourth quarter 2022 Review and Outlook is now available to the public on its website here. As always, a concise master class on monetary impacts and the economic cycle, see A Theory of Interest Rate Cycles. The bottom line: growth bearish and investment grade bond bullish:

Poor consumer spending over the critical Christmas shopping period, slumping exports, sharp deterioration in residential construction, and contracting diffusion indices in both the manufacturing and service sectors will result in business conditions in the first quarter that should be dramatically weaker than the fourth quarter. The risks of recession will become much clearer as 2023 progresses. Headline inflation will recede further from the 1.9% pace in the CPI of the latest six months. These developments are aligned with interest rate cycle theory as well as the case for lower U.S. Treasury bond yields.
Posted in Main Page | Comments Off on Hoisington Q4 2022 Review and Outlook

Danielle’s biweekly market update

Danielle was a guest with Jim Goddard on Talk Digital Network, talking about recent developments in the world economy and markets. You can listen to an audio clip of the segment here.

Posted in Main Page | Comments Off on Danielle’s biweekly market update

Equities don’t bottom when yield curves are inverted

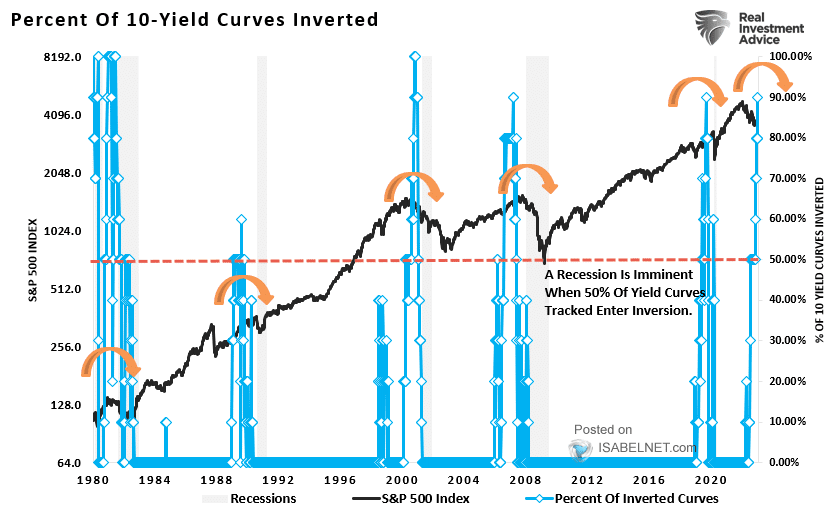
The percentage of global 2/10-year Treasury yield curves inverted at the end of 2021 (long rates lower than short) was 90% (in blue below since 1980, courtesy of Lance Roberts). Historically, recessions (grey bars) and bear markets (S&P 500 in black) have followed when the number of inverted 10-year curves reached 50% (red dotted line).

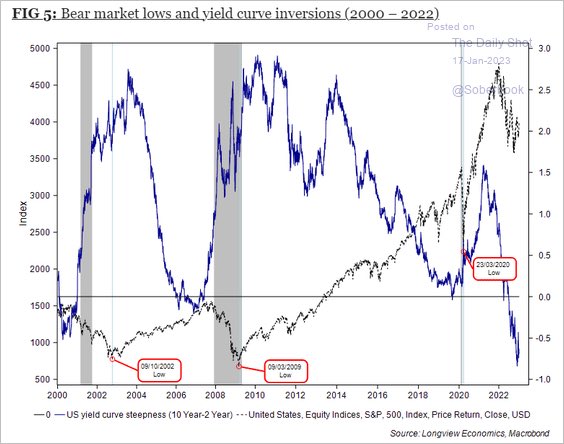
Significantly, while recessionary bear markets (S&P below in grey since 2000 from The Daily Shot) begin from inversions, stocks don’t bottom until central banks have slashed short rates enough to drop them back below long, re-steepening the curve to positive sloping once more. As shown below in blue, today, yield curves remain steeply inverted.

In its seventh month of inversion, yesterday’s much-watched 2/10 US Treasury yield closed at -71bps.

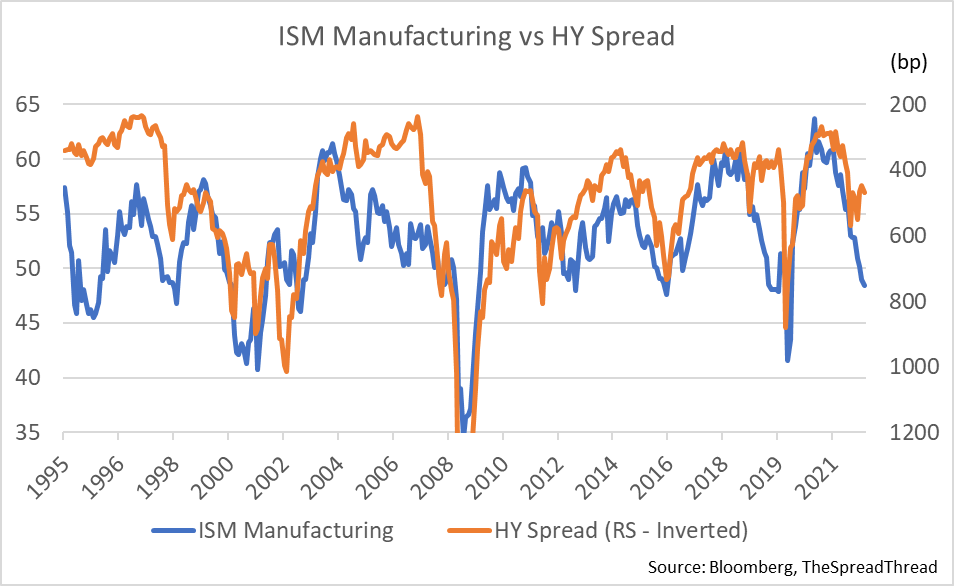
Meanwhile, high-yield corporate bond (HY) spreads ended yesterday at just 412 bps over similar-term treasuries. As shown below, since 1995, a contracting ISM manufacturing index (in blue) leads HY spreads wider (inverted below in orange) as defaults rise. HY bond prices typically bottom with equities once HY yield spreads have reached 800+ bps above similar-term treasuries. HY prices have much dropping yet to do.

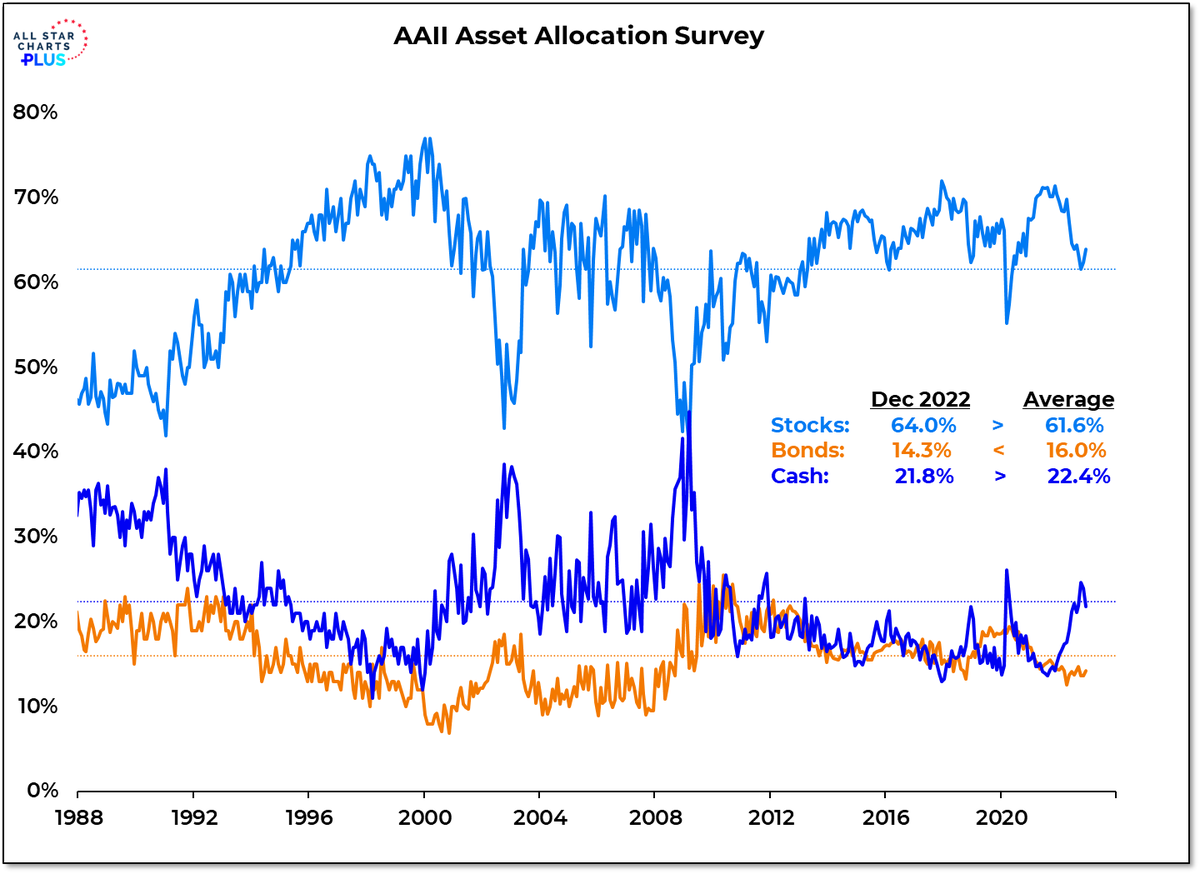
Further portfolio losses will hit hard for holders that came into 2023, 64% allocated to stocks (light blue below since 1988) with 14% in bonds (primarily corporate) and less than average cash levels. 1990, 2002 and 2009 market bottoms arrived once the allocation to stocks had fallen to 40% of portfolios.

Bottom line: no cycle bottom is yet in sight for the economy, risk assets, or the net worth of the masses. Word to the wise.

Posted in Main Page | Comments Off on Equities don’t bottom when yield curves are inverted