
The S&P 500 is down just over 20% since January 4th and a seasonally unusual -6.4% month to date. Under the hood, the most widely held stocks are leading the descent. The top five most expensive S&P 500 companies are now:
- Apple (6.23% of index) -27%
- Microsoft (5.65% of index) -28%
- Amazon ( 2.42% of the index) -50%
- Berkshire Hathaway B (1.67% of index) -16.7%
- Alphabet A (Google) (1.67% of index) -39%
Other 2021 darlings have slipped significantly; here are just a few standouts:
Nividia -46%, Tesla -63%, Meta -70% and Netflix -52%, Uber -43%, Disney -45%,
You might think prices may be nearing a cycle bottom. While that could be possible for an individual name, it is improbable for the market overall. And in a world of highly leveraged global participants holding a ton of increasingly illiquid assets, selling pressure typically spreads from what people would like to sell to whatever assets they can–making no company or sector protected from liquidation.
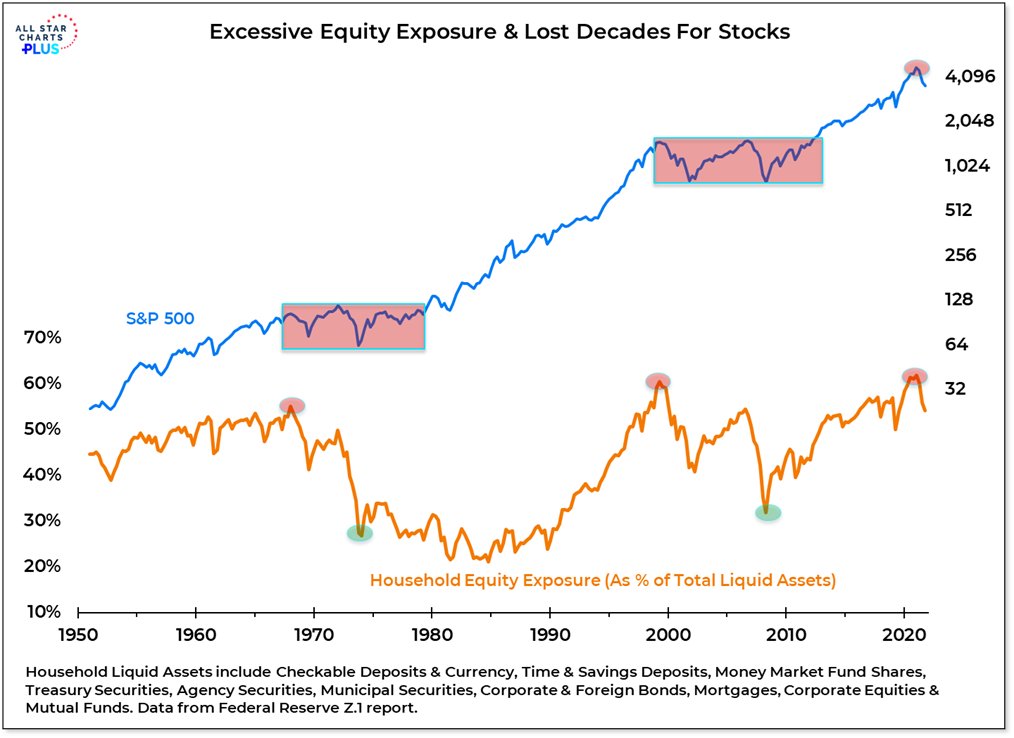
Sentiment reports may appear bearish, but equity positioning, especially in household portfolios, remains (as shown below in yellow) near the secular peaks of 1966, 2000 and 2022. There’s much panic selling yet to come.
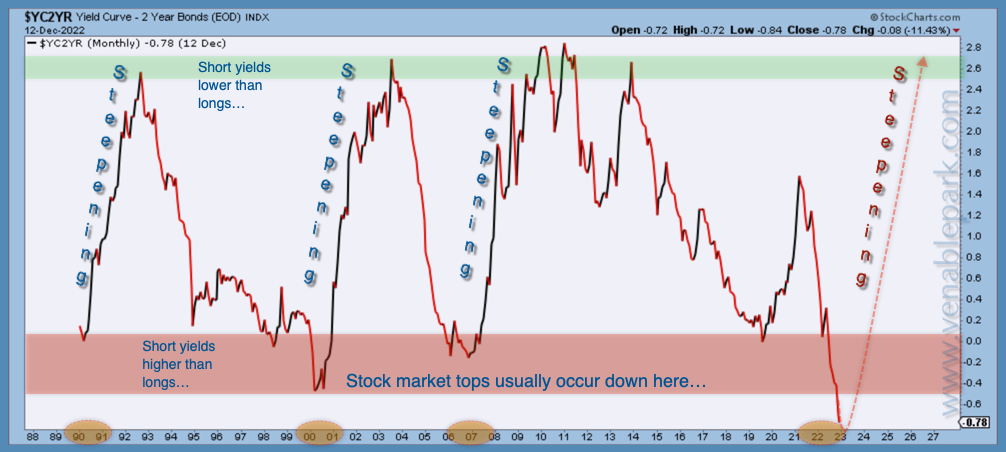
 One of the most historically reliable indicators that a bottom is not yet nigh is that Treasury yield curves remain deeply inverted worldwide.
The US two and ten-year yield spread is shown below since 1988, courtesy of my partner Cory Venable. As highlighted in green, with dates circled along the lower axis, stock markets historically bottom after central banks have responded to slowing growth by slashing short rates enough to drop the front end and re-steepen the yield curve once more. Today, the US Fed is still tightening, and the yield curve is profoundly negative, even more than in the stock market tops of 1990, 2000 and 2007.
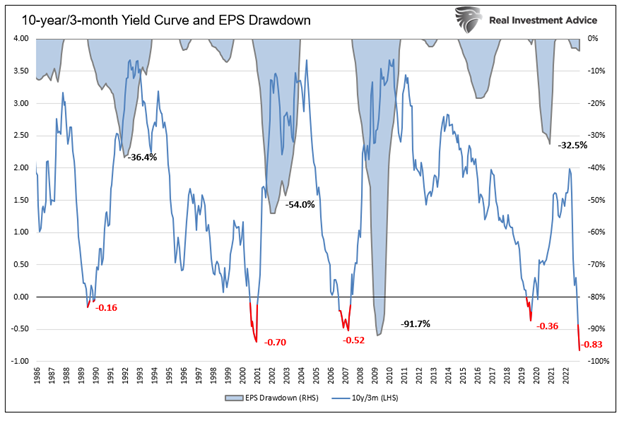
As curve inversions (blue line below since 1986) mark the onset of recessions, they have historically also led an average 25% decline in earnings per share (EPS). As shown below (blue bars) courtesy of Lance Roberts, the drawdown in S&P 500 earnings to date has been tiny in the big picture. At this point, 2023 consensus forward EPS estimates have moved from a delirious $250 down to still optimistic $203. A 25% average cycle drawdown from the peak would mean 2023 earnings of $187 a share. At a forward PE of 15, this would put the S&P cycle low around 2805, some -26% from here. A 12 PE, typical of other cycle bottoms, would see the S&P around 2204, -42% from here.
 A micro reason that the overall market remains vulnerable is that its largest component Apple (6.23% weight), has fallen just 28% and remains widely held and over-hyped.
Yesterday’s close below $132 broke the support line that has held since last June and, as shown below courtesy of Cory Venable, suggests an initial downside target of $94; that would be 49% below Apple’s January peak. If Apple were to bottom at $94, it would be a relatively mild decline relative to past bear markets, where total cycle drops have been greater than 50%.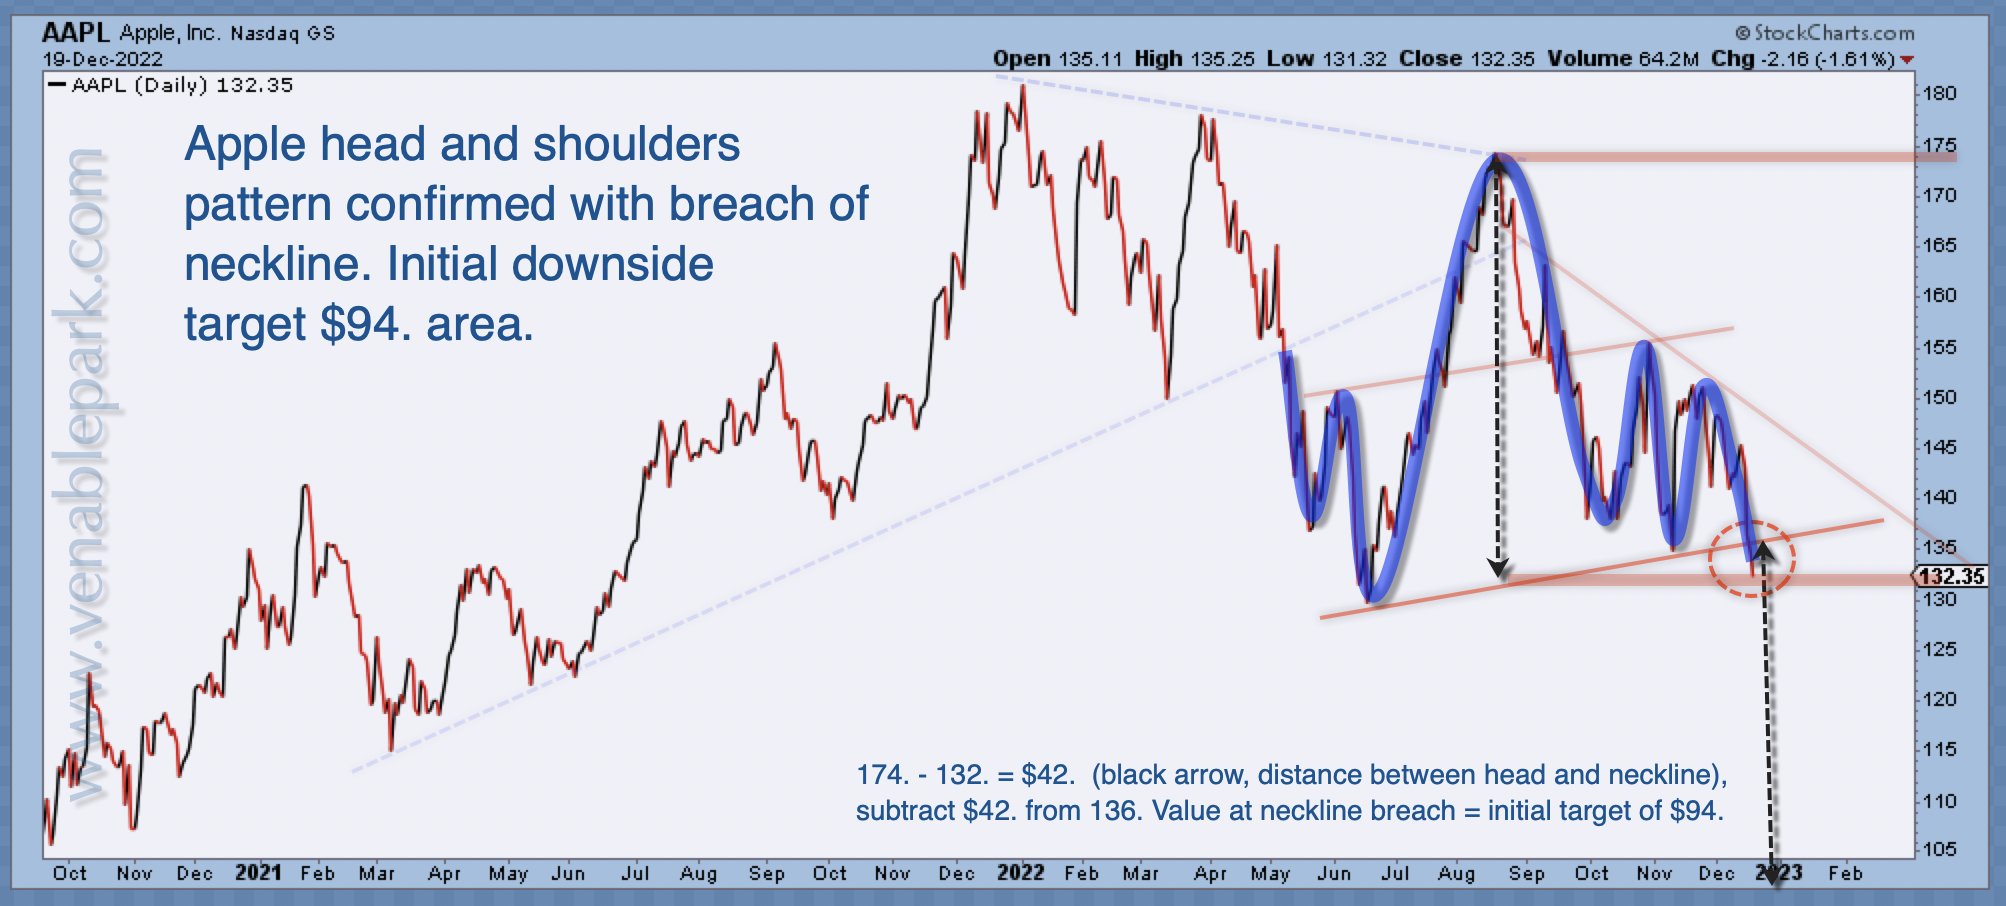 Other S&P heavy-weights, Microsoft and Berkshire Hathaway, have seen similarly modest declines so far when compared with the 2000-02 and 2007-09 full cycle drops.








