The US National Association of Home Builders (NAHB)/Wells Fargo Housing Market Index (HMI), designed to gauge market conditions, fell to 38 in October from 46 in September, now 50% lower than it was six months ago (below 50 is considered negative), and the largest year over year decline in history.
Builders cite higher interest rates for the sharp decline in their confidence (Mortgage News Daily), with the average 30-year mortgage rate at 7.12% on Monday (the highest in 20 years), up from 3% at the start of 2022.
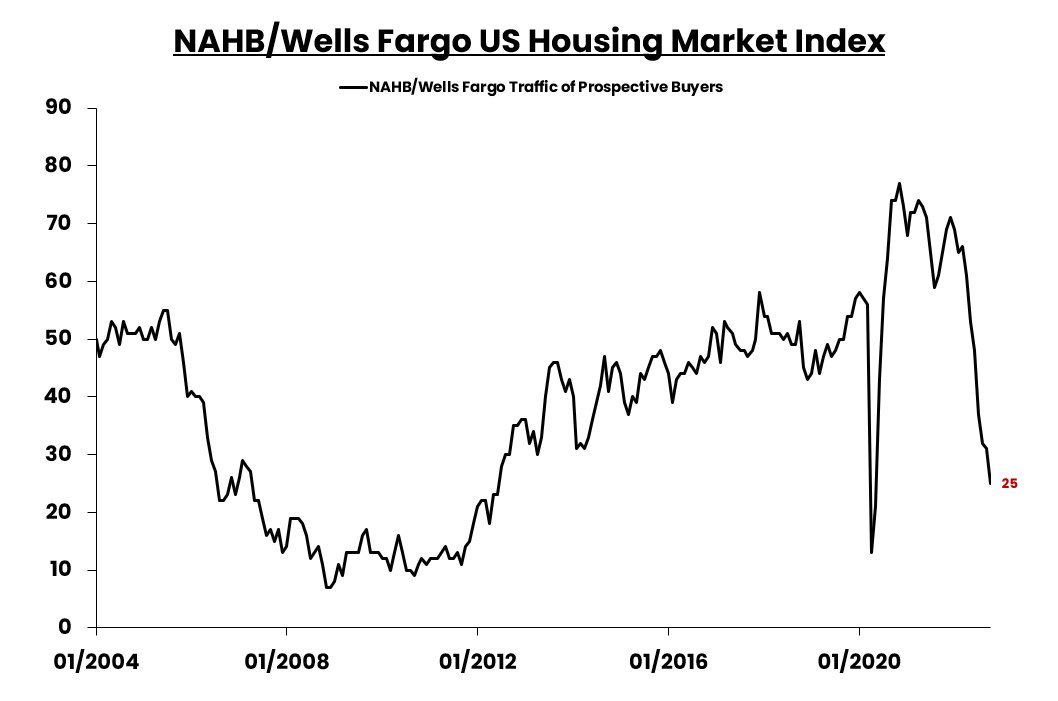
Unsurprisngly, prospective buyer traffic fell to 25 in the latest reading (below courtesy of EPB Macro) with the likelihood of further weakness. The 2008 recession saw this reading bottom around ten and stay there through 2012 as unemployment rose.
Meanwhile, hell is spreading as Canada’s ‘hottest’ property markets freeze.
Many who bought during the 2020-2022 frenzy are underwater in terms of resale value. Approximately 40% of those with variable-rate mortgages have seen a 400% increase in their interest expense from .85 in December 2021 to 4.25% today. HELOC (home equity line of credit) rates have floated near 6%. Private mortgages are harder to find as many previous providers had borrowed funds against their properties to lend to others and are now suffering too. Renewals that can be found are being offered north of 10%.
Then there are those who entered contracts to buy pre-construction condos over the past few years (all the rage in places like Toronto), where buildings are now coming up for occupancy, and buyers are unable or unwilling to complete the purchase of condos priced 10 to 20% above similar resale units. See Preconstruction condo flippers may be left holding the bag as buyers disappear:
Precondo.ca chief executive and co-founder Jordon Scrinko said he has never seen the assignment market this soft before.
“Within the past three to five years, there is a sizeable chunk of the market of the pre-construction buying pool, who bought units that may never actually intended to close on, and some of them — even more worrying — actually factually cannot afford to close on,” Scrinko said.
Scrinko added that if push came to shove, most of these buyers could afford to close, though they never intended to complete the sale and were hoping to flip the contracts for a profit. A more typical client, by contrast, might be forced to pursue the option because of a life event, such as job loss or divorce, or an inability to get financing as interest rates rise.
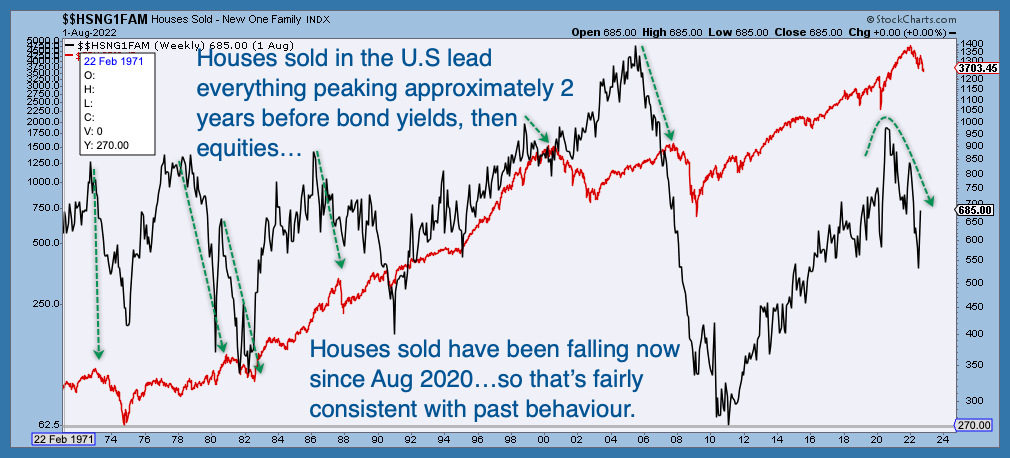
As shown below (courtesy of Stephanie Pomboy), homebuilder sentiment is a leading economic indicator and suggests the unemployment rate (inverted in red below) is about to rise sharply. Debts will be harder to service as it does.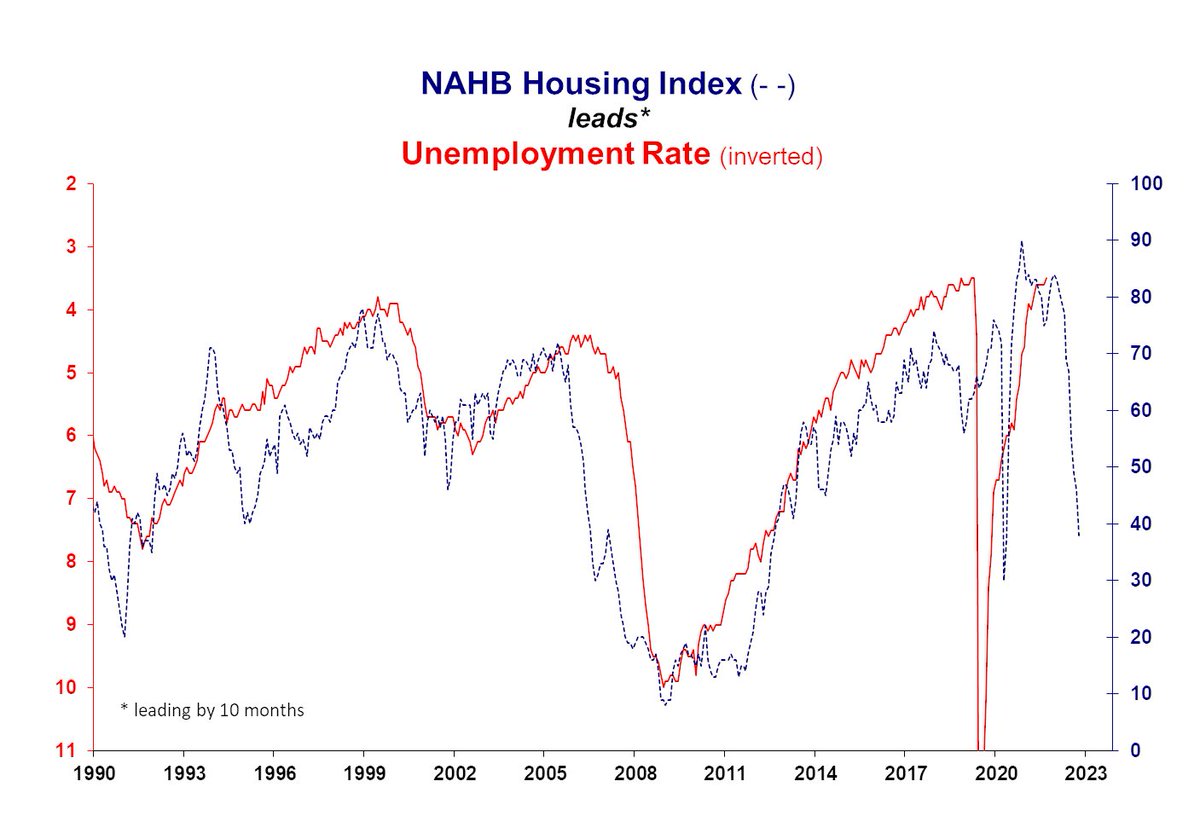 US home sales (below in green) have led stock prices (S&P 500 in red) since 1971 (shown below by my partner Cory Venable), and US sales peaked this cycle in August 2020.
On a hopeful note for borrowers, Treasury yields drive fixed mortgage rates (and other fixed loan rates), and as shown below, since 1982, 10 and 20-year US Treasury yields peaked (bond prices bottomed) 3 to 12 months before the federal funds rate in four of the last six hiking cycles (red x’s marked below). These yields peaked with the fed funds rate in November 1982 and close to it in the Greenspan-led hiking cycle that ended in June 2006 (green checks below). In all cases, as treasury prices rose, home sales, property, and stock prices fell well after central banks started cutting rates again.












