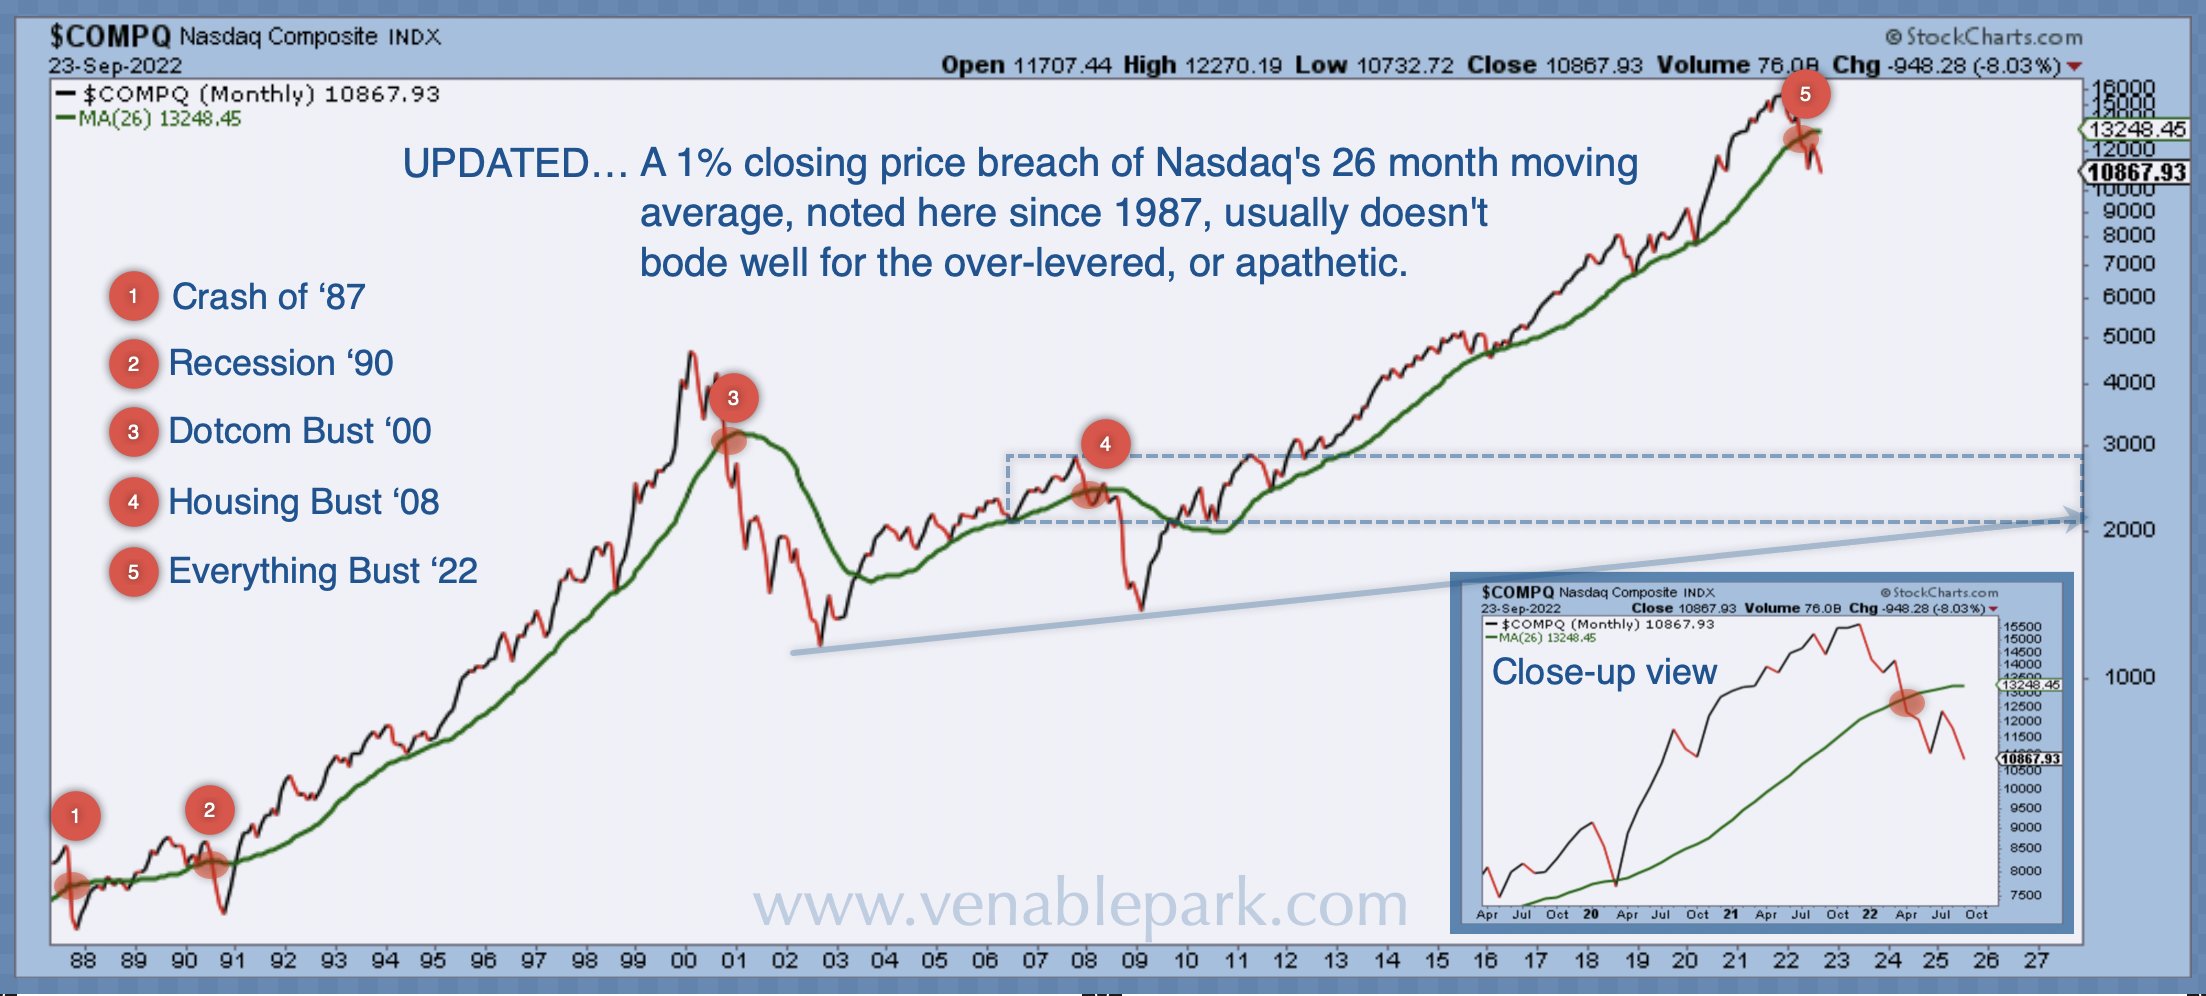
Yesterday, Canada’s TSX stock index closed at 18,215, breaking below its previous July low of 18,329. As I noted in Tech leading lower, the February 2020 high of 17,944 is the next price test on deck for the TSX. As of today’s open, the Canadian benchmark is -18% since March and just 1.5% above where it topped 32 months ago at the outset of COVID.
Under the hood, financials (31.5% of the index) are -24% from their latest high, fossil fuels (17.7% of the index) are -15%, materials (12% of the index) are -29%. The relative strength of financials and fossil fuels has softened the overall index losses to date; that’s unlikely to last.
As I have mentioned many times, our base thesis is that North American stock benchmarks should follow other sectors and emerging markets in retesting the March 2020 lows as this giveback cycle unfolds–some 35% lower for the TSX and 28% lower for the S&P 500. And prices may not bottom there.
With the popping of the everything bubble, the assets most inflated by easy money and speculation have the farthest to fall. Case in point, Canada’s tech leader Shopify was briefly the TSX’s most expensive company by market capitalization last November. It has fallen 85% since and is now 25% below its March 15, 2020, crash low, 7% below where it first traded after its IPO in May 2015.
Canada’s gold mining index has lost 40% since July 2020 and is today 20% above its March 2020 crash low and back to where it was in December 2005. With the much over-loved, over-levered real estate sector in hard return, Canada’s real estate investment trust index is -30% since March 2022, 11% above its March 2020 low, and back to where it was 16 years ago in the fall of 2006.
Before we leap at the chance to buy dividend-producing equities at the lowest prices in many years, we must appreciate that stock market bottoms do not happen while the US Fed is hiking interest rates, nor even when they pause.
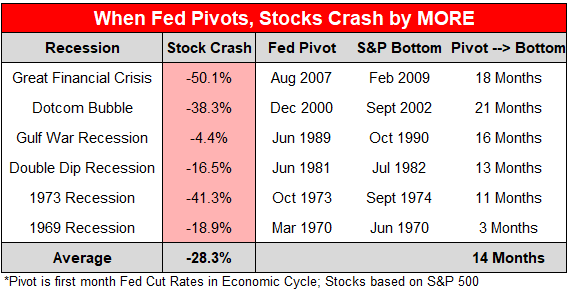
Precisely, in 2007-09 and 2000-02, the market bottom did not materialize until 18 and 21 months after the Fed had been cutting interest rates once more (as shown in the table below, courtesy of Nick Gerli). Since 1969, the bulk of cycle losses happened during the 14-month average time between Fed cuts and market bottoms.
 Today, far from cutting interest rates, central banks have pledged to further tighten monetary conditions into 2023. It bears remembering that the worst recessions and bear markets have coincided with a downturn in real estate–the most widely held asset class. That’s just started now.
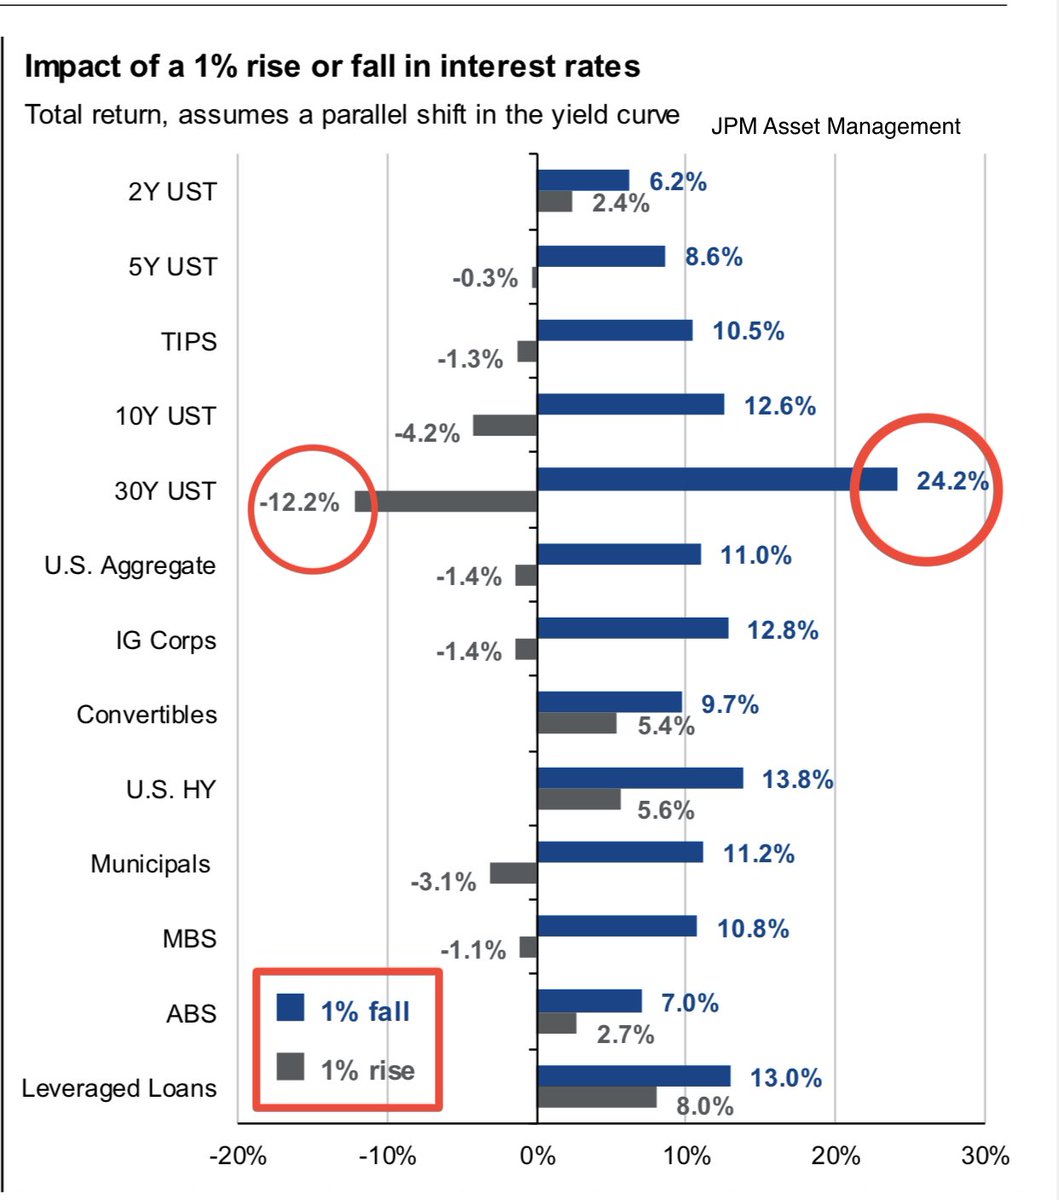
Capitulation selling in equities is still to come. As shown below, courtesy of ISABELNET.com, from an all-time high average of 66% of client assets allocated to equities at the peak in late 2021, allocations have pared back to the 60% range–still higher than the 2007 cycle top and far above the sub 40% typical of past cycle lows.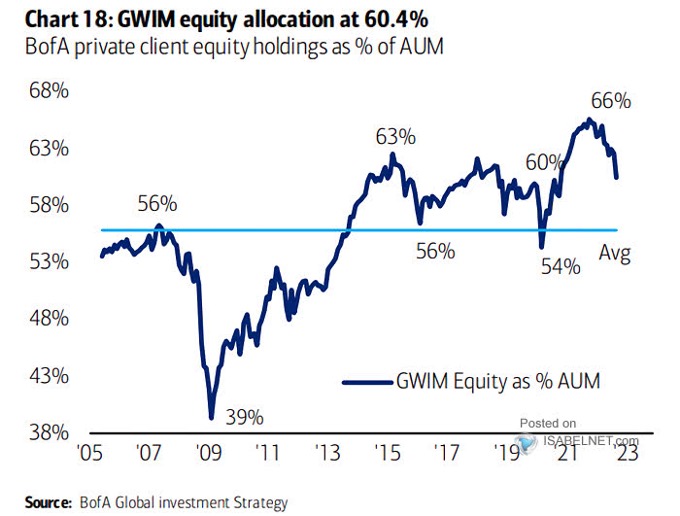 Equities and real estate have not yet priced in the gravity of this downcycle, but investment-grade bonds have pulled no punches; 2022 has been the worst year for investment-grade bonds since 1920. We note that this is the only asset class where prices historically bottom before central banks have completed their tightening cycle. Once the recession is evident and central banks near a pause, investment-grade bonds traditionally strengthen on safety-seeking inflows. As policymakers cut rates again, the bond price gains for each percentage cut are noted in blue below (courtesy of Ayesha Tariq) –some upside to look forward to as other assets work lower.