$95 billion in monthly liquidity reduction to begin today

Starting today, the US Fed has pledged to run off its balance sheet (reduce liquidity in the banking system via ‘Quantitative Tapering’) by $95 billion a month–double the amount they were supposed to have been withdrawing (QT) since the start of June and about 5.5x the $17 billion per month they actually have withdrawn. We will soon discover whether they retain the resolve to execute amid plunging markets.

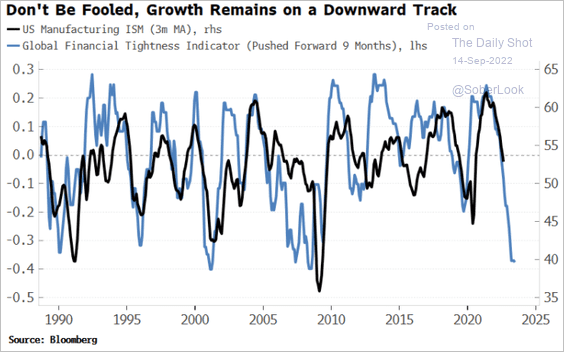
Historically, reducing liquidity is a negative for financial markets. Moreover, (shown in blue below since 1987, courtesy of The Daily Shot), it has also led economic downturns (US manufacturing ISM in black) by about nine months.

On top of QT, global central banks are following the US Fed in a rate hiking cycle that’s moving about three times faster than the ‘measured’ .25% increments typical since 1980.

Fed fund futures predict that US policy rates will move to 3%-3.25% next week and 4.25%-4.5% by early 2023 (up from 0%-.25% in March 2022!). By then, it’s feasible that the US will have reported its third and possibly fourth consecutive quarter of negative GDP growth.

Will confirmation of a US recession cause the Powell-led central bank to blink and pause its too-much–too-late tightening efforts? As today’s mounting layoffs turn into rising unemployment claims, which of the dual mandate–stable prices and full employment–will the Fed prioritize when push comes to shove?

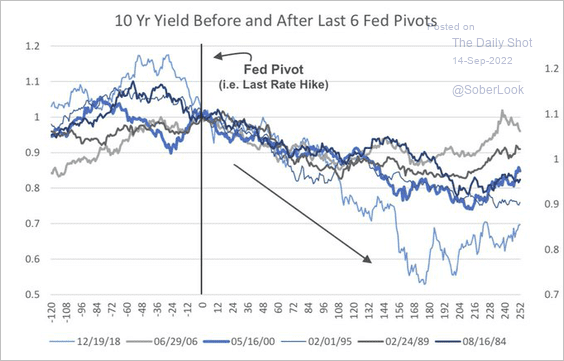
Bond yields and interest rates should be topping out if a Fed pause comes within the next six months. During the last six Fed tightening cycles (as shown below since 1984), the bond market has moved ahead of the Fed, with 10-year treasury yields peaking before the Fed’s last hike and tumbling in the months after that as investment grade bonds rose.
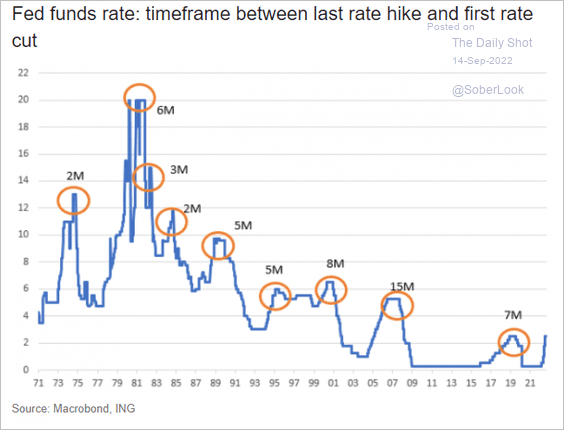
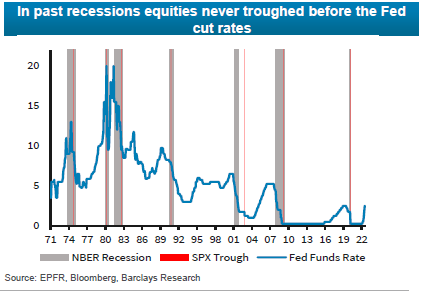
Fed rate cuts on the short-end, meanwhile, have historically not started until two to fifteen months after the last policy hike (as shown below since 1971).
It’s worth noting that equity markets have historically not bottomed (S&P price troughs in red below since 1971) until months after the Fed has started loosening again (blue line), near the end of recessions (grey bars), when growth momentum is finally turning positive once more. #notthereyet.
Posted in Main Page | Comments Off on $95 billion in monthly liquidity reduction to begin today

Consumer dreams evolving

There’s an old saying: the best days of owning a boat are the day you get it, and the day you sell it. The sentiment is especially true when people borrow to buy recreational items. While usage of the lifestyle item is periodic, related expenses tend to be continuous.

Recreational properties and equipment saw a frenzy of buying during the first two years of the pandemic. Now, schedules are normalizing, money is tighter and reducing expenses is the new dream. As motivated sellers outnumber buyers, the available supply of nearly everything rises. For more, see: For Every Vacation Home Fantasy, There is a Harsh Financial Reality:

Sales of second homes are way down from last year’s boom, dipping below pre-pandemic levels (February 2020) for the first time in two years, due in part to high prices and rising mortgage rates, said Daryl Fairweather, chief economist at Redfin.

Many Americans [and Canadians] still envision a second home as a source of family memories, wealth, rental income and tax benefits, if everything goes to plan. These buyers don’t always grasp the risks such as trouble renting the home, family squabbles over the property and unexpected costs.

Posted in Main Page | Comments Off on Consumer dreams evolving

Lower prices improve affordability and investment prospects

Well before the rate increases this year, many would-be investment properties had rents insufficient to cover expenses, and owners were subsidizing the negative carry in hopes that capital gains would more than repay their costs over time. This helpful calculator allows us to compare relative numbers.

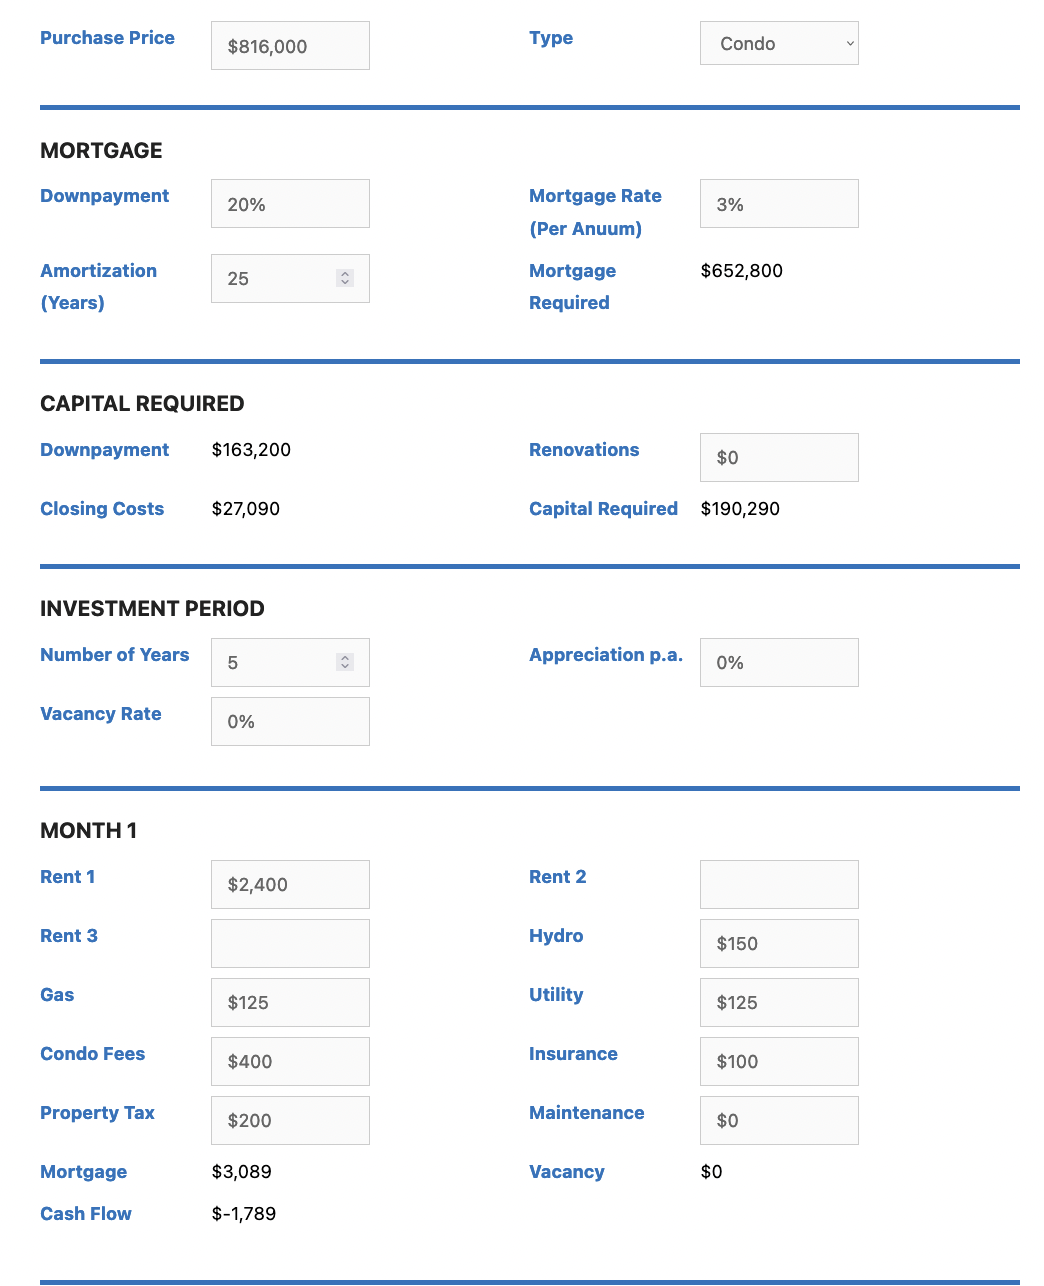
In February 2022, with the average Canadian national sale price of $816,000, a 20 percent downpayment, and a fixed mortgage rate of 3%, a typical rental condo in Toronto had a negative cash flow of about $1789 per month. But with a 3% annual appreciation rate over a five-year term, the total return could still be positive.

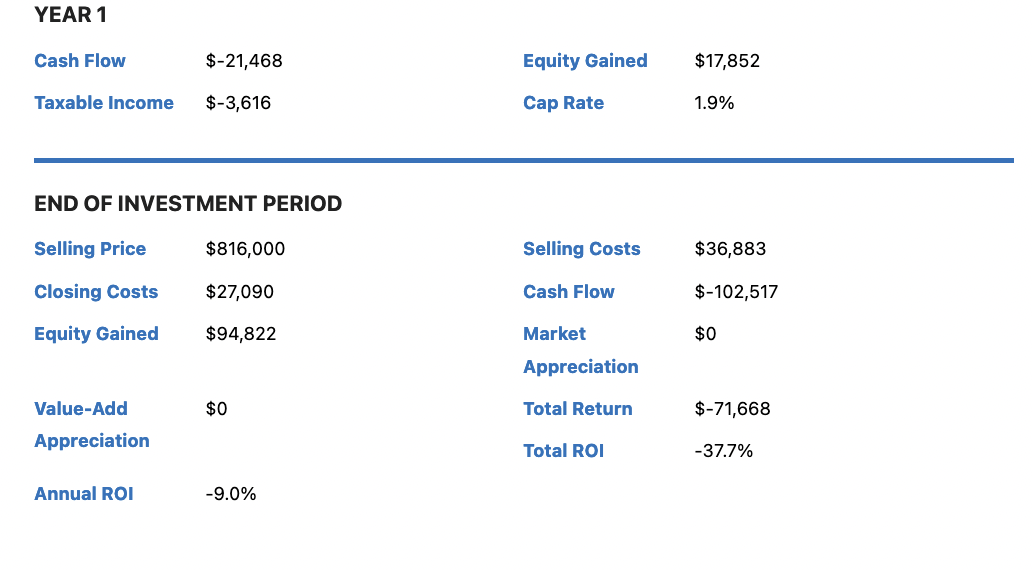
If property prices stagnate with zero capital appreciation, the negative monthly cash flow for the same investment amounts to a 37% loss over the five-year mortgage term (as shown below).

With a mortgage rate of 5%, the total loss on this negative-carry property balloons to 70% over a five-year holding period.

If the market price falls 20% (happening now?), the total loss on this average condo could be greater than 70% over a five-year holding period. Note: most property calculators do not allow one to input/model negative appreciation rates, even though negative returns have typically followed previous cycle tops.

The upside for those waiting to buy is that affordability can improve with falling prices, notwithstanding higher mortgage rates. For example, the average Canadian home price at $816,000 in February with a 3% mortgage rate required a higher 20% downpayment ($163k) and higher monthly mortgage payment ($3,089) than a $629,000 average home price in July (20% downpayment $125,000) and a mortgage rate of 5% ($2,927 per month). Further price declines could greatly improve affordability over the year to come.

Returns are also looking up for investors who wait to buy. However, doing so takes some cyclical insight, patience and cash at the ready.

Posted in Main Page | Comments Off on Lower prices improve affordability and investment prospects