Danielle’s bi-weekly market update

Danielle was a guest with Jim Goodard on Talk Digital Network talking about recent developments in the world economy and markets. Here is a direct audio link.

Posted in Main Page | Comments Off on Danielle’s bi-weekly market update

Owing more and affording less

Home price appreciation has far outstripped any median disposable income gains (after tax) in Canada over 20 years, particularly since 2020.

Nationally, the relative home price change to the end of 2020 (on the lower right in blue, source) can be compared with disposable income gains (grey line) since 1975 and the much smaller overshoot in US home prices at their bubble peak in 2006 (on left).  After US median home prices collapsed 40% nationally by 2011, American disposable income growth was able to get ahead of home appreciation for a few years.  More recently, however, US home price inflation has once more surpassed disposable income growth. As shown below, courtesy of Lance Roberts, filling the gap between income, savings and spending needs (in green below since 1999) has seen consumers continually increasing their debt per capita (black line).  The median household is now adding about $6400 in new debt per year to meet their obligations.  This is the opposite of financial progress.
The problem is worse in Canada. As shown in the 2022 Semi-annual State of Housing Report from the Mortgage Professionals of Canada, the average house price in the country’s most populated provinces, Ontario and B.C, reached a ludicrous 22 x the median household disposable income at the end of 2021. Median rents are also rising far beyond household income gains. Not surprisingly, Canadian residential mortgage credit rose 9.4% in 2021, and Canadian household debt to a record 186% of household disposable income. Some 66% of overall Canadian mortgages were fixed terms in 2021, with an estimated 37% of them up for renewal over the next two years. About one-third of those with a mortgage also has a floating rate home equity line of credit (HELOC). While 34% overall had variable-rate mortgages in 2021, some 45% of new mortgages taken over the last year have been floating rates.  Canadians reportedly added $2 billion in HELOC debt over the past 28 days alone.

With interest rates leaping, median fixed mortgage payments have risen 56% since 2020 (as discussed here), and the expected rise in floating rate interest costs on all manner of credit has only just begun.

With negative real wage growth for months now, something has to give.  That something is pretty much everything else that can be cut.  The latest household spending data below shows all the sectors now suffering.  This is the stuff of consumer-led recessions. Some folks were trying to bridge their financial deficits by gambling in financial markets for a while.  But that’s proving a bust, as usual.  The basket of so-called “meme” stocks that were all the rage last year is now back to where prices were pre-mania, with further capitulation selling yet to come.  Unfortunately, those who borrowed to buy will be left with capital losses and debt.

I explained all of this mess in my book Juggling Dynamite (2007) as follows:

During market peaks, waves of excited investors spring up all over.  (We have also seen the same phenomenon in overzealous real estate markets). Housewives and business people alike are encouraged that they can be “plugged in.” Thanks to online information, they can figure out investing themselves in just minutes a day…The ability for people to make split-second decisions about investments based on split-second information is more likely to be hazardous than beneficial to one’s financial health.  At best, this feeds into the neurotic human tendency to be rash, impatient, and emotional…After the market crashed in March 2000, ads for online traders fell off dramatically.  Like a drug pusher who has exhausted the resources of his customers, they faded back into the shadows to await the next big frenzied opportunity.

They’re retreating now as well.  Unfortunately, like bugs to a zapper, this destructive behaviour is timeless.

Posted in Main Page | Comments Off on Owing more and affording less

Stocks are behind the curve (as usual)

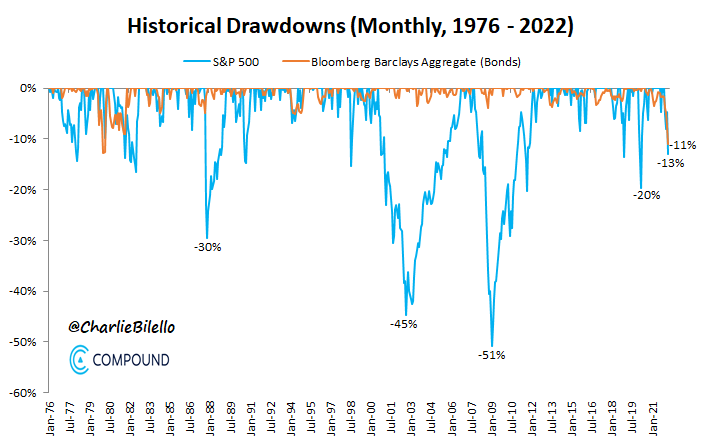
The S&P 500 and the US government bond index are now down about 12% from their highs (similar to Canada’s treasury bond index).

A big difference is that while this has been the largest drawdown for government bonds in 40 years (shown below since 1974), stocks are only about halfway to a -20% bear market on the US large-cap stock index and the TSX is just -6% in Canada.


Of course, Treasuries have guaranteed income payments and maturity dates, while stocks have none.  Still, if both are repricing for the sharpest inflation and monetary tightening response in decades, bonds have discounted the worst, while large-cap stocks–slow to get the math–are behind the curve (as usual).

It’s especially the case since equities came into this tightening cycle at some of the highest valuations in history with the most passive index-following products, funds and portfolios ever held by households and institutions.  The median bear market for large-cap equity indices from the few comparable historical extremes (1929, 1973-74, 2000 and 2008) was greater than 50%, not -20.

In recent years, global equities have had an unusually extended period of gains over government bonds.  As shown below, since 1970, this ratio has historically reversed violently during equity bear markets when government bonds take the total return lead for years after that.
As an asset class, equities have more downside work to do before they are attractive as an investment.  Of course, don’t expect most asset managers or sell-side analysts to admit this.  The lion’s share of the finance industry depends on a perpetually bullish equity outlook to keep customers in the highest-fee products and portfolios. It doesn’t work out well in the end, though.  Long-always fees plunge with equity markets every cycle, and many of their clients/customers will jump out of moving vehicles to sell low and leave for another service near the bottom.  Round and round they go.

The JP Morgan representative in the segment below lobs the typical long-always pitch.  The Cantor Fitzgerald rep has a cross-asset analysis mandate, so he can offer a more honest relative-risk assessment.

Phil Camporeale, JPMorgan Asset Management portfolio manager, and Eric Johnston, Cantor Fitzgerald head of equity derivatives and cross asset, join ‘Closing Bell’ to discuss Camporeale’s thoughts on inflation peaking, why Johnston believes the Fed’s hawkishness hasn’t been priced into equity markets and more.  Here is a direct video link.

Posted in Main Page | Comments Off on Stocks are behind the curve (as usual)