The S&P 500 and the US government bond index are now down about 12% from their highs (similar to Canada’s treasury bond index).
A big difference is that while this has been the largest drawdown for government bonds in 40 years (shown below since 1974), stocks are only about halfway to a -20% bear market on the US large-cap stock index and the TSX is just -6% in Canada.
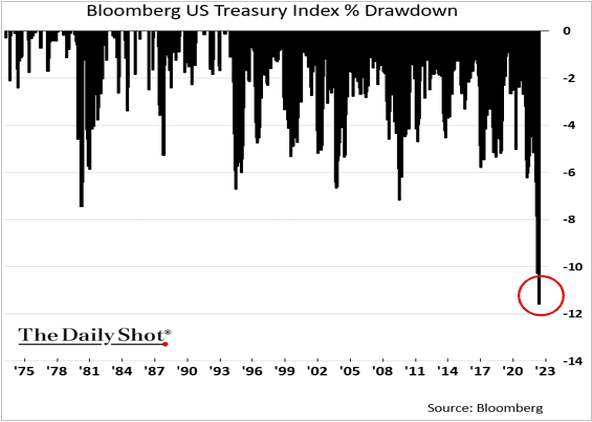
Of course, Treasuries have guaranteed income payments and maturity dates, while stocks have none. Still, if both are repricing for the sharpest inflation and monetary tightening response in decades, bonds have discounted the worst, while large-cap stocks–slow to get the math–are behind the curve (as usual).
It’s especially the case since equities came into this tightening cycle at some of the highest valuations in history with the most passive index-following products, funds and portfolios ever held by households and institutions. The median bear market for large-cap equity indices from the few comparable historical extremes (1929, 1973-74, 2000 and 2008) was greater than 50%, not -20.
In recent years, global equities have had an unusually extended period of gains over government bonds. As shown below, since 1970, this ratio has historically reversed violently during equity bear markets when government bonds take the total return lead for years after that.
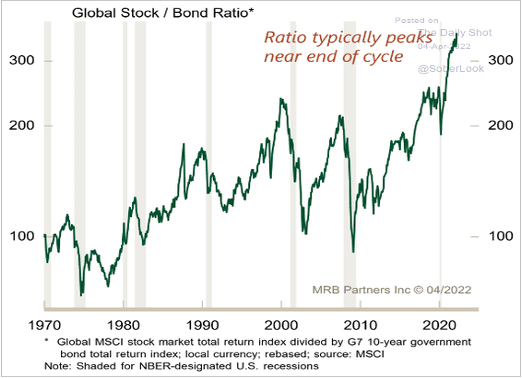 As an asset class, equities have more downside work to do before they are attractive as an investment. Of course, don’t expect most asset managers or sell-side analysts to admit this. The lion’s share of the finance industry depends on a perpetually bullish equity outlook to keep customers in the highest-fee products and portfolios. It doesn’t work out well in the end, though. Long-always fees plunge with equity markets every cycle, and many of their clients/customers will jump out of moving vehicles to sell low and leave for another service near the bottom. Round and round they go.
The JP Morgan representative in the segment below lobs the typical long-always pitch. The Cantor Fitzgerald rep has a cross-asset analysis mandate, so he can offer a more honest relative-risk assessment.
Phil Camporeale, JPMorgan Asset Management portfolio manager, and Eric Johnston, Cantor Fitzgerald head of equity derivatives and cross asset, join ‘Closing Bell’ to discuss Camporeale’s thoughts on inflation peaking, why Johnston believes the Fed’s hawkishness hasn’t been priced into equity markets and more. Here is a direct video link.