
Yield spread oil ratio-signaling bear market and recession

This morning, the spread between the ten and two-year U.S Treasury yields has narrowed to just .405%, and oil (WTI) has moved above $92.

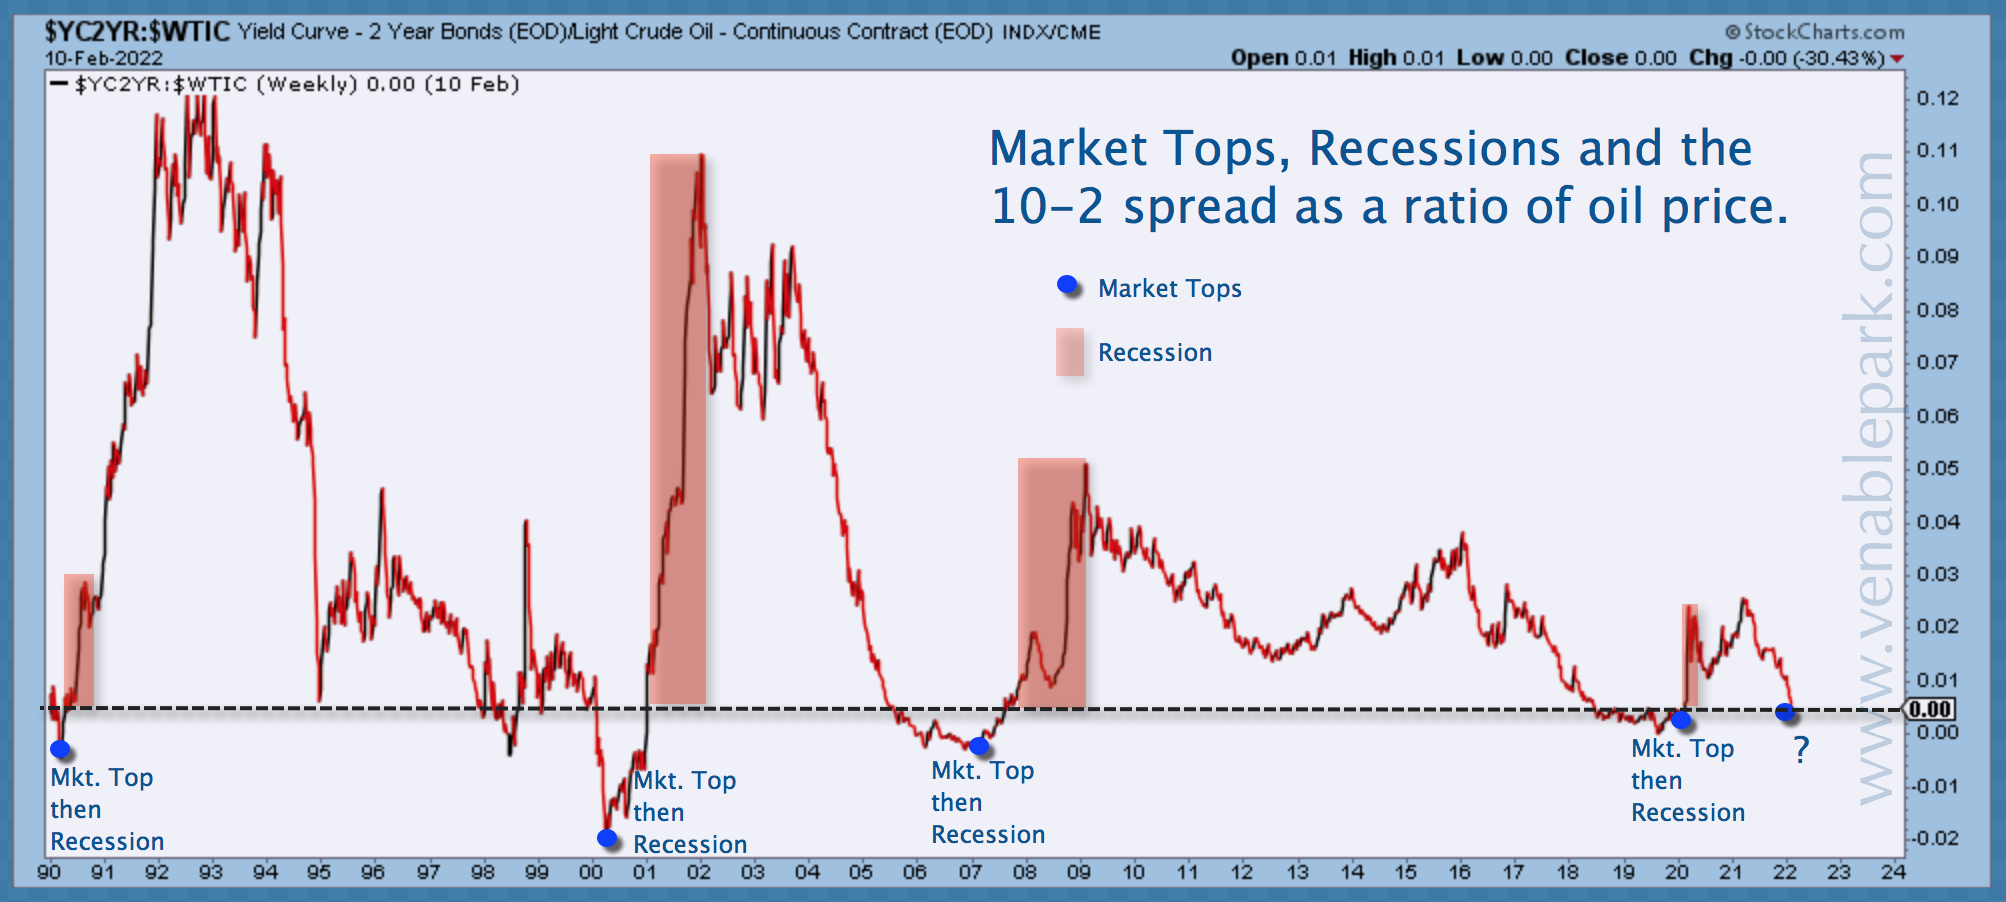
As shown below in my partner Cory Venable’s chart since 1990, when the ratio of these two financial indicators fell to zero (yields compressing faster than oil price is rising) in 1990, 2000, 2007 and 2020, a bear market and recession were in process.
So far, the Dow is off 5.6% from the highs (transports are -12.0%), the S&P 500 is -7.8%. Ex-energy and financials, the S&P 500 is near -10%.

The TSX is flat thanks to its 45% concentration in late-cycle holdouts financials and petrochemicals. Word to the wise, this late-cycle outperformance is not long for this world:  petrochemicals, commodities, materials, tech, and financials are all the worst-performing sectors in the slowing growth and inflation phase now unfolding. The Nasdaq is -14%, and the economically sensitive Russell 2000 is -16.9%–the same level it was at the start of 2021.

Meanwhile, retail investors plowed a record $34.1 billion into U.S. equity funds last week, further reducing their already historically minuscule allocations to bonds and cash. Global fund flows show similar trends.

At the onset of the next cyclical bear market of historic proportions, retail is once more long on debt and overvalued assets but short on dry powder.

Doing the opposite of the crowd is a critical component of longer-term financial success and investment optionality.
Posted in Main Page | Comments Off on Yield spread oil ratio-signaling bear market and recession

Years of mean reversion will punish present holders

With more than 70% of its 3600 c0nstituent companies down more than 20% from their highs, the sentiment-leading NASDAQ index is now trading below its 50-, 100–, and 200-day moving averages for the first time since March 2020.

The 2020 market plunge was abrupt but too short and shallow to correct for cyclical extremes in valuations and animal spirits.  A retest was always coming.  The Federal Reserve-inspired market excesses of the last two years have been breathtaking.  If the recent weakness is the lasting trend change, the downside prospects are also spectacular.

Lance Roberts lays out the reality from present levels in A 50% Decline Will Only be a Correction:

Every bear market in history has an initial decline, a reflexive rally, then a protracted decline which reverts market excesses. Investors never know where they are in the process until the rally’s completion from the initial fall.

…When you realize that a 50-percent decline in prices would still maintain the “bullish trend” of the market, it just shows how exacerbated markets are due to a decade of monetary interventions.

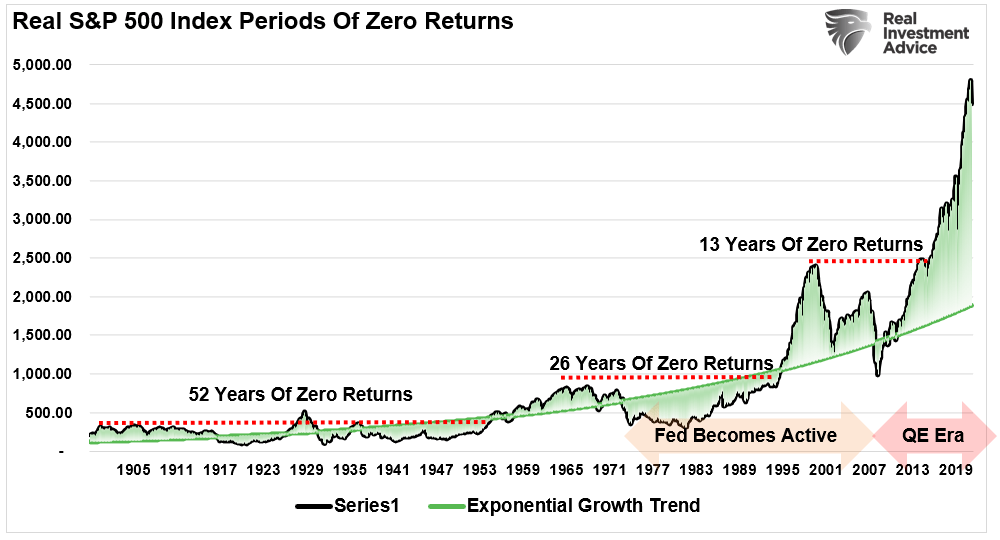
Lance offers the 40,000-foot view in this chart of the S&P exponential growth trend (green line) versus price (black) since 1900 and notes that other lesser periods of overshoot above-trend have always been followed by very long periods of no returns.  Just the facts, folks.

Posted in Main Page | Comments Off on Years of mean reversion will punish present holders

Pop Quiz: What would it take to return the TSX to where it topped in 2008?

The oil and gas overweight (13%) in Canada’s TSX typically helps buoy the Canadian stock market late in each market cycle.  Oil prices leap, explode the highly levered global economy and then plunge with demand once more.  Comparatively, just 3% of the S&P 500 is oil and gas.

With West Texas Crude back at an eight-year high today–last seen in 2014, and before that in the commodity cycle peaks of 2008-2011– the TSX is less negative this afternoon than most global markets.  With the S&P off nearly 8% from its December high, the TSX is down less than 2 percent since October.

Interestingly, currency traders are not buying the trend, with the loonie at .786USD, down against the greenback on the day, week, month and year to date.

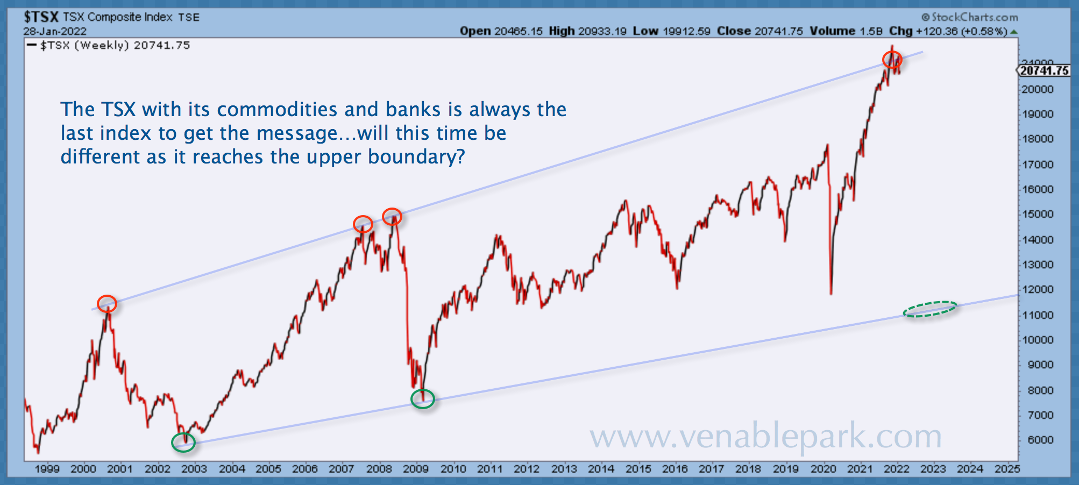
As shown below from my partner Cory Venable since 1998, after going parabolic on retail inflows during 2020 through 2021, Canada’s TSX index (which most Canadian stock funds, ETFs and equity portfolios track) is precariously peaked.  Few present holders appreciate how vulnerable this makes their capital.  Or that a relatively modest 30% bear market from here would return the Canadian stock market to the 15,000 area where it topped with oil in June 2008–13 years ago.  And with secular support in the 12,000 area (lower line above), a 30% retracement would be a historically modest correction cycle from here.

Who will have outperformed then?  We are going to find out.

Posted in Main Page | Comments Off on Pop Quiz: What would it take to return the TSX to where it topped in 2008?





