In November, at around $1700 per share, Canada’s e-commerce superstar Shopify (SHOP) was priced at a crazy 40 x the company’s revenue and was officially the most expensive component of the TSX Index. Since then, a 36% decline has knocked SHOP out of the top spot and back to where it was in October 2020, but its shares remain some 575% higher over the last three years. We’ve seen this story before.
In 2000, Nortel was Canada’s most widely loved and expensive company. In the 2008 cycle, it was Research in Motion (now Blackberry). Both saw a 90% price decline after reaching this milestone. In the case of Shopify, the company may well have better longevity than either of these predecessors. Still, a drop of more than 70% from its cycle peak (taking the shares back to the $500 area) would be within historic norms from valuation highs.
Believe it or not, a similar potential downside looms for Apple, which has also seen its market capitalization (prices x shares) triple since 2018 (as shown below).
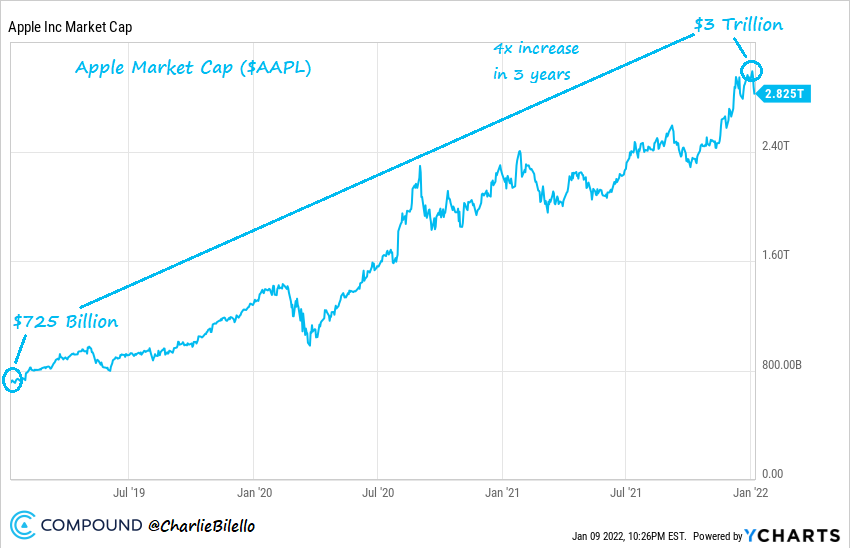 Apple has popular products, and its revenue has increased 42% and net income 62% over the last three years. But the tripling in share prices has been chiefly about multiple expansion and the willingness of share buyers to pay more and more. As pointed out by Charlie Bilello, Apple currently trades at 4x sales and 32.4x earnings, up from 2.8x sales and 12.4x profits just three years ago.
The critical takeaway is this: just because a company has excellent products or dominates a particular sector does not mean that its shares will be a rewarding investment at every price in the cycle. Even if the company is well managed and continues for decades, this is true.
At the height of the 2000 tech bubble, the five most expensive and widely owned stocks were Microsoft, Cisco, Exxon Mobil, GE, and Intel. These comprised 18% of the NASDAQ index market capitalization before tanking with the rest as the basket fell an average of 83% over the following two years. Today, the five most expensive companies (Apple, Microsoft, Amazon, Meta and Tesla) represent an unprecedented 37.8% concentration in the index.
While average indices are off modestly from their 2021 highs, under the surface, 66% of NASDAQ shares have already fallen by 20%, and 40% are down by at least half.
The concentration in financials (32%) and oil companies (13%) has so far propped up Canada’s TSX within a few percent of its November high–this happened at the start of the 2000 and 2008 bear markets too. The resilience won’t last indefinitely.
The negative start to 2022 is a step in the mean reversion needed–but much more is yet to come.