ECRI: the consumers that drive 70% of economy are in trouble

According to economic forecaster Lakshman Achuthan, Wall Street is ignoring a striking consumer spending slowdown that will translate into an underwhelming holiday season. “There’s still this narrative that the rebound is there,” the Economic Cycle Research Institute co-founder told CNBC’s “Trading Nation” on Wednesday. “The hope had been people would shift from goods to services, and that would keep reaccelerating… That hasn’t happened.”  Here is a direct video link.

The chart below, courtesy of Mac10, summarizes why consumption is struggling to hold up.  While services were closed and stimulus cheques enabled a burst of goods’ spending and financial speculation, retail sales, durable goods, stocks (led by the eight most expensive tech companies), corporate profits and home prices all soared.  Real wages have not.  A higher cost of living for crucial items like shelter, fuel, food, and transportation is naturally crimping spending ability.  Even the few who have the savings and income to keep spending can only use so many cars and fridges and houses.  And they are unlikely to need to replace recent purchases for a few years hence.
While asset owners are so far still euphoric on surreal price gains since March 2020 (Wilshire 5000 Total Market Cap Index below in red), consumer sentiment (in blue) has abruptly disconnected.  Until stock, options and crypto trading somehow takes over as the economy’s primary engine, consumer sentiment is still driving the economic bus here; and it’s not looking bullish.

Posted in Main Page | Comments Off on ECRI: the consumers that drive 70% of economy are in trouble

Grantham on max (misplaced) Fed-faith

The shares of world-leading companies with incredible products still commonly end up devastating as investments when bought at euphoric prices.

Investors’ faith in the Federal Reserve has become so unshakable that not even the highest inflation in three decades is enough to cause a sell-off in assets, according to Jeremy Grantham, the value-investing giant and co-founder of Boston-based asset manager GMO. He spoke with David Westin on Bloomberg Television’s “Wall Street Week.” Here is a direct video link.

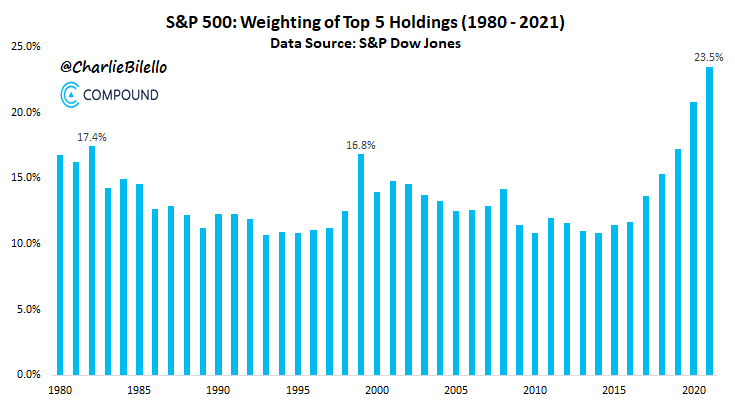
As shown below, since 2012, the eight most expensive tech companies now make up 30 percent of the S&P 500 market capitalization.  This means that a world of funds, managers, and portfolios that track the S&P 500, are less diversified and more risk-concentrated than commonly understood.

Posted in Main Page | Comments Off on Grantham on max (misplaced) Fed-faith

We are here👇

Facts exist whether we choose to acknowledge them or not.

The chart below, courtesy of John Hussman, shows the current S&P 500 price as a ratio of historically reliable valuation measures (bottom x-axis) and actual subsequent S&P 500 12-year total returns (y-axis) since 1928.  The present extreme implies a negative total annual return (including the 1.3% dividend yield but before fees) over the next 12 years.


Some more facts that corroborate the extremity of present conditions:

  • Market participants are aggressively confident:  net speculative long bets that the S&P 500 will rise further are the largest since October 2020, while net speculative short bets that the US 10-year Treasury price will decline are the most since February 2020.
  • Trading in the options market is 50% above normal levels, and trading in bullish call options is at levels only seen ahead of the 2000 tech wreck.
  • Equity portfolio managers are out of dry powder with cash weights at historic lows of 2%.
  • The cryptocurrency market is highly levered and valued at over $3 trillion, up sixfold from $500 billion a year ago.  Contagion risks between asset classes are epic.
  • $865 billion flowed into global equity funds year to date, 3x the prior annual record and equivalent to all the retail buying activity over the last 20 years.
  • Option trading volumes representing massive leverage are about 50% more active in nominal dollar terms than actual stock trading.

It is tough to be hyperbolic about the present capital loss prospects.

Ironically, the consensus calling for run-away inflation and negative implications for treasury prices are simultaneously ignoring the fact that higher inflation has been historically devastating for stock prices, especially when starting from extreme valuations and a cycle high in earnings, like now.  Hussman offers some important context:

It is a fiction that stocks, at any price, are better than low-yielding bonds. If you want to make that argument to investors – here I’m speaking directly to analysts on Wall Street and the Fed – at least have the intellectual decency to test your estimates against decades of actual subsequent market returns, and show them side-by-side. By our estimates, the S&P 500 is likely to lag Treasury bonds by about 8% annually over the coming decade – the largest gap in history, and slightly worse than the outcomes after 1929 and 2000. For a discussion of equity risk premium (ERP) models, including the Shiller-Black-Jirav “excess CAPE yield”, see A Good Response to a Bad Situation.

Yes, bond yields are lower than they were in 2000, but equity valuations are also more extreme. The end result for relative returns is likely to be similar to that of previous bubbles. Even an “error” as large as the one we’ve seen in the past 12 years (which would require future valuations to remain at bubble extremes) would leave S&P 500 total returns at or below the lowly returns on Treasury bonds.

…The S&P 500 lagged Treasury bills from 1929-1947, 1966-1985, and 2000-2013. 50 years out of an 84-year period. That’s just what overvalued markets do.

We are here.  Just the facts.

Posted in Main Page | Comments Off on We are here👇