Inflation has always been a lagging economic indicator and as transitory as financial bubbles.
In the last forty years, the National Bureau of Economic Research (NBER) reports that the low in inflation readings occurred an average of 15 quarters (3.75 years) after the end of each recession. The average number of years from the beginning of the recession to the low in bond yields has been four.
The most extended lag followed the recession of 1991 when inflation bottomed 29 quarters (7.25 years) after the economy. The shortest lag was six quarters after the recession ended in June 2009 when inflation bottomed in the last quarter of 2010. (Hoisington Management).
The start and end dates for recessions are officially proclaimed many months post in retrospect. But even if the 2020 economic contraction optimistically ended in April 2020, it would be typical to not see an inflation low this cycle for several months and possibly years yet to come.
In the latest US CPI estimate for July 2021 (here), BLS reported that non-seasonally adjusted consumer prices increased 5.4% year-over-year, down slightly from June. US CPI peaked at similar levels in June, July, and August 2008 before slowing to 4.94% in September 2008 as asset prices began to tank.
Over the last 12 months, most notable was a 41.8% rebound in gasoline prices, 19% for natural gas, a supply-constrained 41.7% rise in used vehicle prices, 6.4% for new, and 2.8% for the shelter index. Apart from these extreme and passing price pressures induced by the  pandemic, the underlying inflation trend appears to have peaked in April (as charted on the left) just as Treasury prices predicted. See Jeff Snyder’s latest Inflation More Than Hints ‘Transitory’:
“…should inflation rates continue to play out as they have, each simply the predictable results of, yes, transitory factors having their day and then fading away into ugly history. From supply problems to base effects and mostly Uncle Sam, these aren’t permanent changes to the situation no matter how many times the last of those is called “stimulus.”
Instead, easily foreseeable, once those recede sufficiently what’s left is what was there underneath the entire time – and, as we keep finding in global evidence, the basis and basics behind the US economic rebound may not have been nearly as awesomely robust as (inflationary) advertised. On the contrary, all of that fluff (Warren Buffett’s second shot at “red hot”) mainly the product of those, yes, transitory artificial factors.”
The consensus seems to have sensed this shift and moved on to new worries.
Full round trip in @GoogleTrends searches for #inflation @FT pic.twitter.com/olqbGI6kvB
— Liz Ann Sonders (@LizAnnSonders) August 12, 2021
Public and private employers planning to significantly cut employees’ pay who work remotely full-time seems likely to be the next wake-up call. After the last year’s debt-fuelled goods and housing frenzy, less consumption was inevitable. Pay cuts will surely depress it even more.
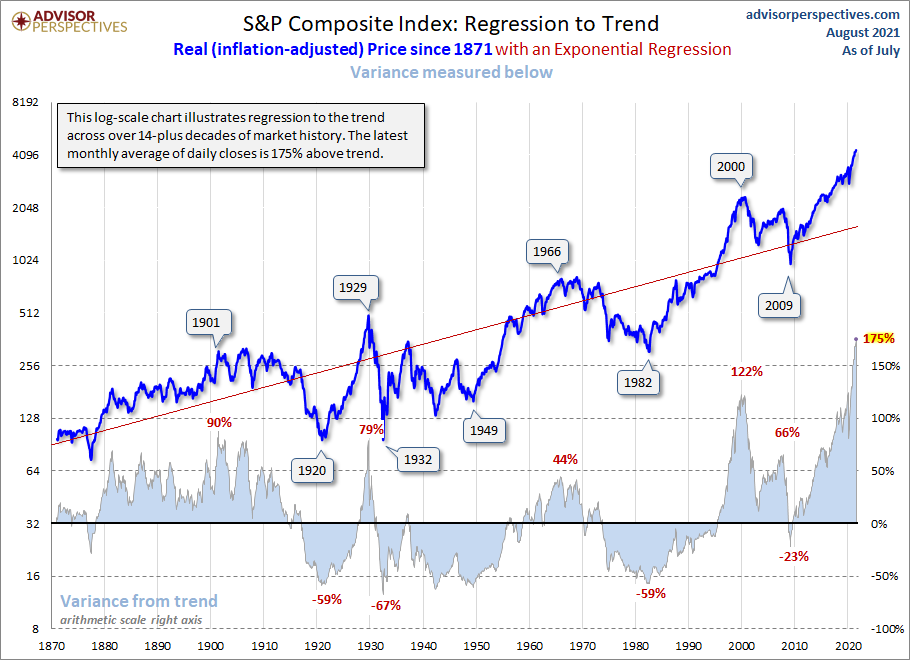
At the highest valuations in human history, asset markets have vastly overestimated the rates of growth and inflation possible for the next couple of years, at least. As shown in the S&P 500 real price index below since 1870, such periods of extreme delirium have never gone unpunished.