Experience trumps extrapolation

Lance Roberts offers some valuable perspective in Knowledge vs. Experience:  Why most investors end up losing, including the non-log chart of the S&P 500 Index below since 1957.  This chart reminds us of just how historically extreme the rise in stock prices has been this cycle, and that the other two times when the index traded far above the exponential trend line–1997 to 2000 and 2003 to 2007–it ended very badly for capital allocations there. Nevertheless, it is classic for humans to extrapolate current trends into the presumption of a new ever-rising paradigm.  Here’s Lance:
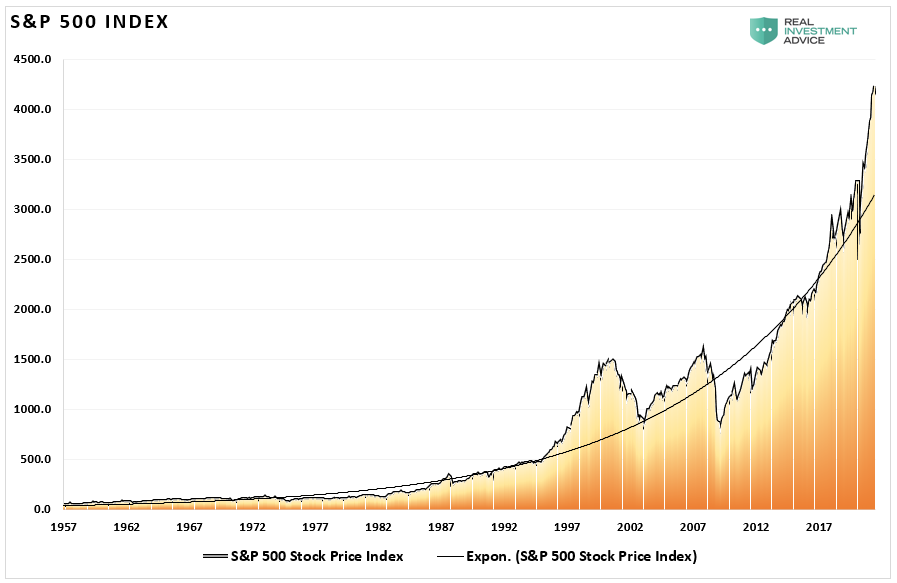
The chart often gets put into a log scale to reduce the skewness towards large numbers. However, a non-log chart provides a better visual for this explanation. Pay attention to the exponential growth trend line.

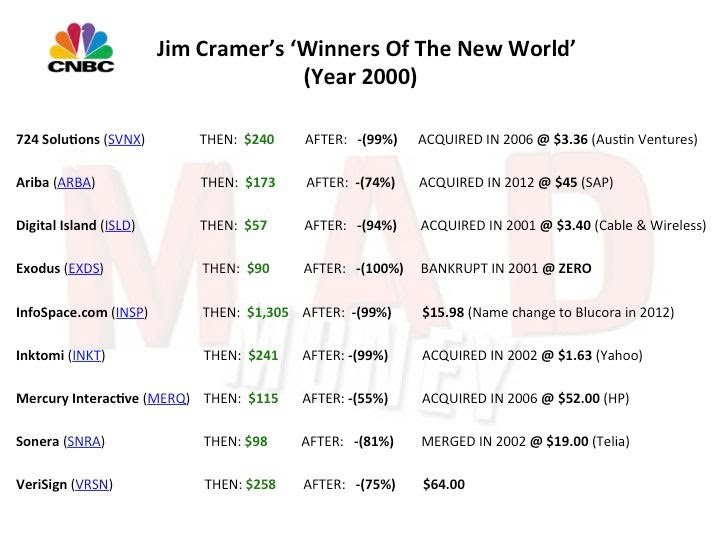
Those with their wits about them will recall that we have seen this movie before.  Below is a list of companies that Jim Cramer (then CNBC contributor, now, Mad Money host) touted in 2000 as “winners” for the next decade.  Their prices at the supremely confident peak are noted in green, as well as their 55 to 100% declines in the bear market that followed. I remember all of this like it was yesterday…as does veteran money manager Doug Kass:
At times, the markets can be quite exciting. During the halcyon periods of prosperity and abetted by many (like the financial media who have no dog in the hunt) – traders who act like gamblers are encouraged to ‘play the trend’ and, increasingly do so en masse and as a ‘community.’

History proves this all ends badly and will result (as it did in the early and late 2000s) with an exodus of individual traders/investors out of the markets.

Most of these traders will fail to survive the current market cycle and will not be around in the next cycle.”
 

Posted in Main Page | Comments Off on Experience trumps extrapolation

Reduced birth and longevity rates exert deflationary impacts for years

The COVID-19 pandemic has exacerbated the deflationary trends of falling birth and longevity rates, especially in the world’s largest consumer nation–America.  The effects will last for years.

Life expectancy in the U.S. fell by 1.5 years in 2020, the biggest decline in decades, as Covid-19 killed hundreds of thousands and exacerbated the rise in drug overdoses, homicides and some chronic diseases. Life expectancy decreased an average of 0.22 years in other peer countries between 2018 and 2020.

U.S. longevity had been largely stagnant since 2010, declining in three of those years, due in part to an increase in deaths from drug overdoses. Heart disease-largely caused by diet and lifestyle–remains the nation’s leading killer.  See the WSJ U.S. Life expectancy–the biggest decline in generations:

The full toll of the pandemic has yet to be seen, doctors and public-health officials said. Many people skipped or delayed treatment last year for conditions such as diabetes or high blood pressure, and endured isolation, stress and interruptions in normal diet and exercise routines…

The pandemic also had an effect on births, as the number fell last year to the lowest level in more than four decades, continuing a fertility slump and likely showing that the spread of a deadly virus dissuaded some women from pregnancy.

Posted in Main Page | Comments Off on Reduced birth and longevity rates exert deflationary impacts for years

Treasury yields leading risk markets lower

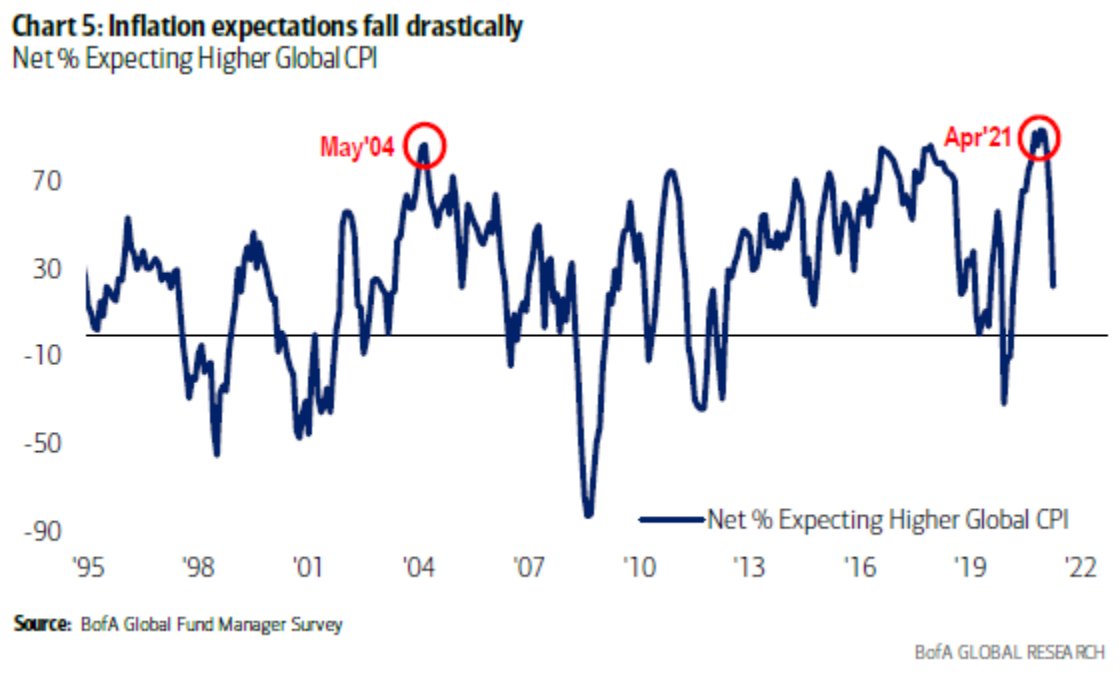
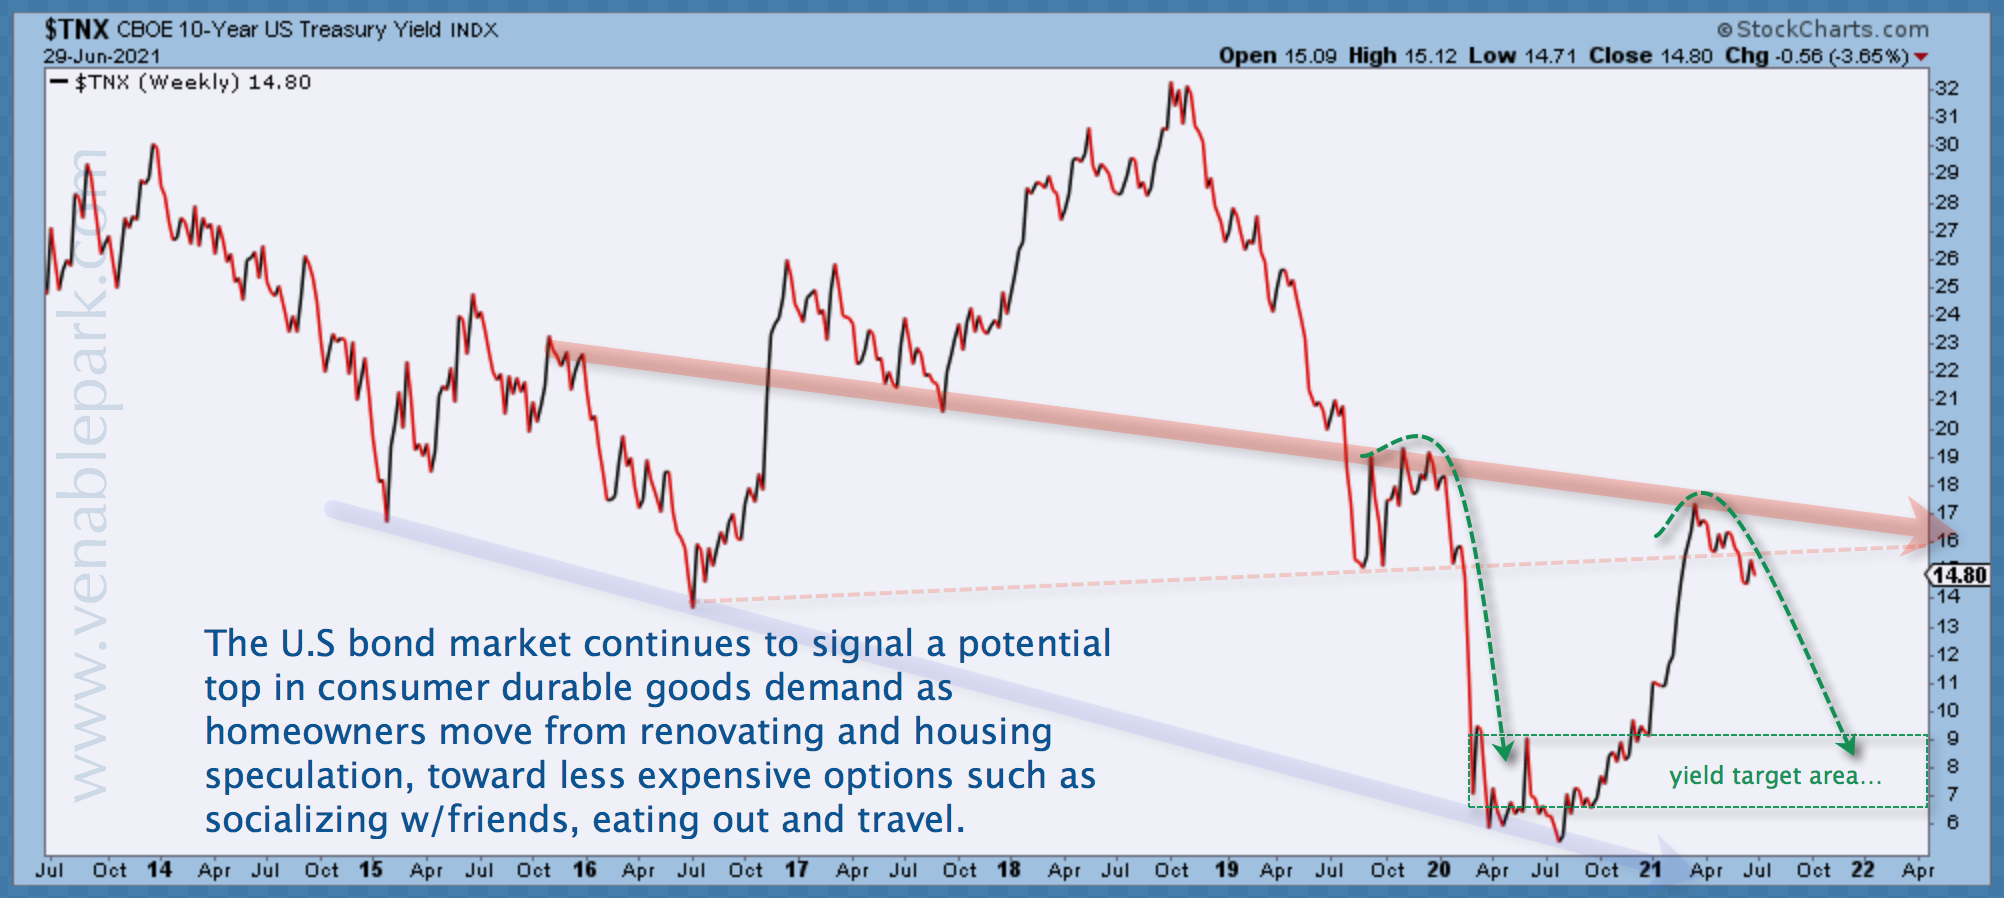
Born of inflation mania and rampant speculation, the latest downturn in risk markets has been telegraphed by declining global inflation expectations (below since 1995) and falling Treasury yields since the end of March 2021.

As noted in my partner Cory Venable’s chart from the end of June (below), the US 10-year Treasury yield broke under 1.50% last month, down from 1.74% on March 31st.  With a rapid move to 1.20% yesterday, our yield target of sub-1% remains probable (green box area) as goods spending subsides from a COVID-fevered pitch.


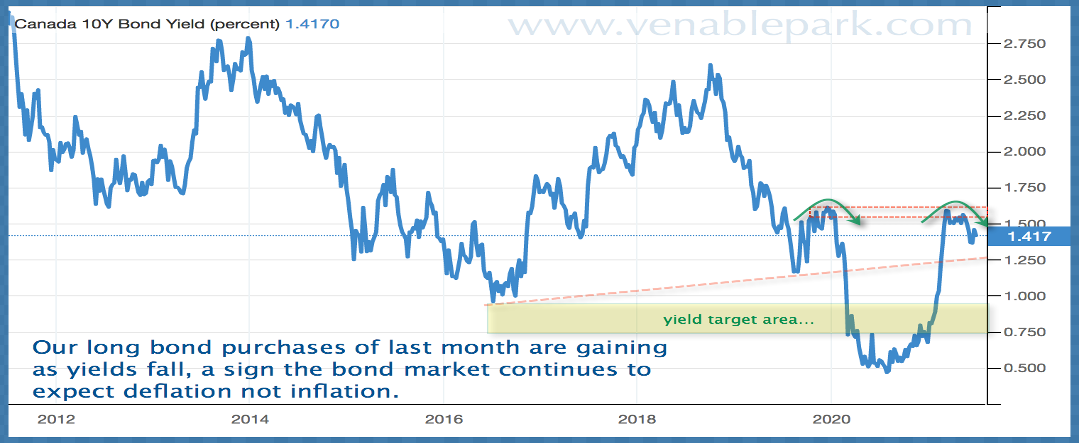
Canadian Treasury yields follow suit, with Canada’s 10-year yield closing at 1.147 yesterday from 1.417 last month and 1.67 on March 19th.  Cory’s end of June chart below highlights our sub-1% yield target here as well (yellow band) as government bonds rise.

This is about growth/inflation expectations and risk assets that have wildly overshot all reasonable financial prospects.

Economist David Rosenberg said he agrees with North American monetary policymakers on one thing: concerns about runaway inflation are overblown. Here is a direct video link.

Posted in Main Page | Comments Off on Treasury yields leading risk markets lower