Inflation-cycle déjà vu

Recent inflation readings and the market action year to date remind of past cycles. Recall that inflation is a lagging economic indicator.

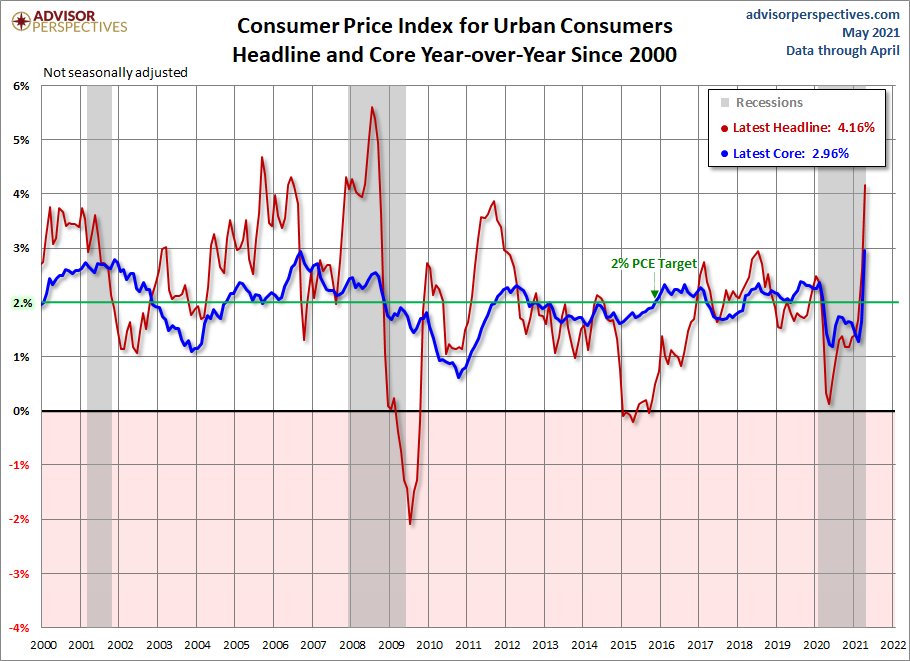
In the 2008 cycle, inflation and commodity prices topped in the second quarter on expectations of insatiable Chinese commodity demand, ditto in 2011 as the post-GFC recovery ran out of steam, 2006 as the US housing bubble burst, and 2000 when Y2K-driven tech spending finally exhausted (see CPI chart below since 2000, courtesy of advisorpersepectives.com).
Although some short-term supply bottlenecks and financial speculation might drive commodity prices and inflation expectations further from here, a few big-picture facts are worth noting.

First, higher prices naturally work to incentivize supply more than demand and therein lie the seeds of mean reversion.

Second, before the pandemic, services account for 67% of personal consumption expenditures in the US (Canada is similar) and goods about 33%.

As the pandemic shut down some services over the past year, the consumption of goods accelerated above the mean as households used government support and low-interest rates to buy a record amount of things.  With some 80% of the economy already open today, pent-up demand is now, more than ever, on the services side.  Services use a lot fewer commodities than goods production.

The consensus expects consumer spending to keep accelerating because some households have higher savings now than before the pandemic, but household debt to after-tax income ratios suggest another probability.

Before the inflationary cycle of the 1970s, household debt to income ratios averaged about 60% as mortgage and bond rates moved toward 20%.  Then in the early 80s, inflation and interest rates finally began to fall, and households surfed that wave all the way down with a borrowing and spending spree that drove US household debt to a record 135% of household income by 2007.  Having worked down over the past 14 years to 88% today, American households still have further work in rebuilding their balance sheets toward the long-term mean of 60% on this financial strength and stability metric.  Canadian households are, unfortunately, much further behind in the process, with an average debt to income ratio of 171% in the third quarter of 2020 (down from 181% in the fourth quarter of 2019).  While the personal savings rate (which includes debt repayments) has risen on government subsidies and payment deferrals over the past year, a sustained period of this is required.

While balance sheet rebuilding is best for households, it’s hard on consumption-dependent economies. GDP growth was mostly driven by household spending in 2020: 67.6% for the US and 56.5% for Canada.  Developing and emerging economies are much less driven by domestic consumption, i.e., they depend on exports for western consumption for most economic growth. Chinese consumption, for example, drives just 43% of its economic growth, and that’s higher than most developing economies, where average household incomes are lower.

Aging populations will slow global growth dependent on debt-fuelled consumption in all major economies wanting fewer goods and more savings, along with technologies that allow us to do more while spending less.

But there’s another more imminent reason to suspect inflationary pressures will be short-lived.  What’s inflated most in the past decade is asset prices. If history has shown us anything, it’s that extreme asset inflation is always transitory.

Extreme asset prices eventually collapse of their own weight and pull the spending impulse out from underneath highly levered economies (read Robert Frank’s excellent book The High Beta Rich (2011) for a reminder of how and why), and all the central banks and governments in the world are not able to prevent it.  Case in point, just the relatively minor sell-off in the S&P 500 over the past couple of weeks evaporated some $950 billion in market value off the balance sheets of asset owners–a little over half of the stimulus spending pledged in the entire American Rescue Plan Act of 2021.  This one stat offers a sense of the deflationary powers that a full bear market cycle has in store.
Posted in Main Page | Comments Off on Inflation-cycle déjà vu

Michael Lewis’ new book a ‘sweeping indictment’ on pandemic response

Universal Pictures has purchased screen rights to The Premonition: A Pandemic Story, the new book by Michael Lewis about several U.S. heroes who, in the early days of Covid-19, tried to sound the alarm about the dangers of underestimating the deadly seriousness of the killer virus.  Lewis spoke to NPR last week about his findings (see audio link below), also see Michael Lewis’ ‘The Premonition’ Is A Sweeping Indictment of the CDC’.

Much has been written about how the pandemic came to be, but not so well known are the details about how it was able to spread so quickly in the United States.

Author Michael Lewis has written a new book, The Premonition, that fills in those blanks. And it is a sweeping indictment of the Centers for Disease Control and Prevention.

Posted in Main Page | Comments Off on Michael Lewis’ new book a ‘sweeping indictment’ on pandemic response

Equities priced for negative returns for a decade from present levels

As I observed last Thursday in Coming off the boil?, some leading speculative measurements have waned over the past couple of months, and the trend continues this week with the tech-heavy NASDAQ leading broader markets lower.

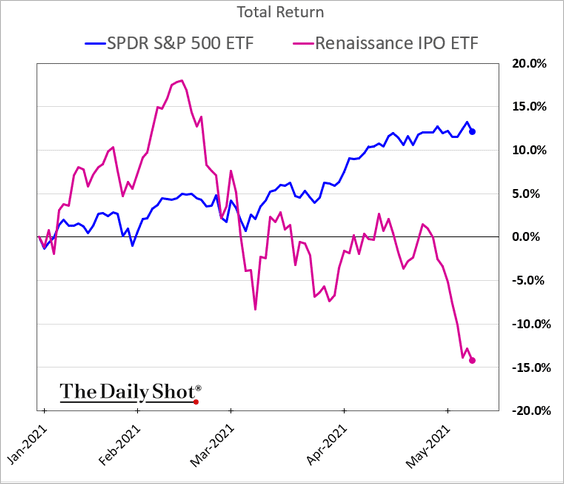
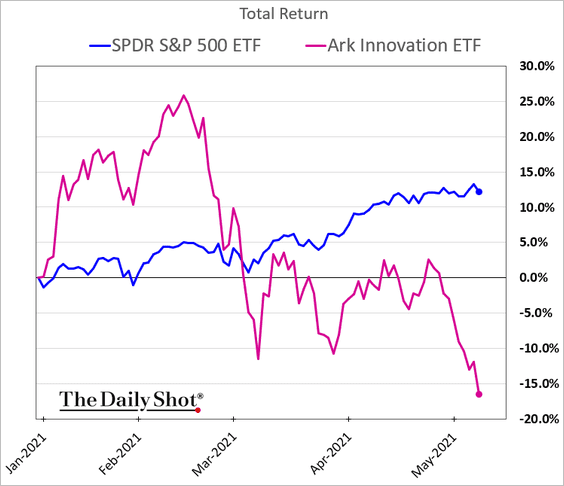
The ARK Innovation ETF (shown on the lower left in pink from The DailyShot), all the rage since March 2020, is now -34% from its Feb 16, 2021 peak, and the Rennaissance IPO ETF (lower right in pink–full of crowd favourites like Zoom, Coinbase, Pinterest, Peleton and more) is -26%.  Both are shown below relative to the S&P 500 in blue since January.

The small-cap Russell 2000 index that led large-cap stocks higher into March 2021 is now -6.3% from its high and has given back any outperformance against the S&P 500 year to date. It’s a start, anyway.

This could finally be the beginning of the much-needed risk reappraisal or just another consolidation phase.  One thing is for sure, just as spreading COVID-19 increases the incidence of mutation, illness and death, drops in extremely overvalued asset prices increase the likelihood of financial contagion among highly levered markets and participants.

Despite all the inflation and growth hype in commodity prices, meanwhile, Treasury prices have so far voted in an opposite direction, with ten-year yields in Canada and America lower today than at the end of April.  This has afforded an opportunity to add government bonds on sale with yields three times higher than last summer and with capital gain prospects as the risk-trade moves into liquidation mode.  Eventually, there will be a time to reduce Treasuries and use the cash to buy corporate debt and equities once they have mean reverted to investment quality entry points once more. Of course, don’t expect mainstream financial commentators or participants to acknowledge this.

Acknowledge or not, as John Hussman reminds in Counting the Chickens Twice, the fact is that extreme equity valuations have set present owners up for a decade+ during which government bonds are likely to outperform equity returns–just as they did in 52 of the last 84 years (62% of the time):

“…the S&P 500 lagged Treasury bills during the 18-year period from August 1929 to May 1947, and during the 21-year period from November 1961 to October 1982, and during the 13-year period from March 2000 to April 2013. That’s 52 years out of an 84-year span. It’s just what happens when valuations become extreme.

Understanding this requires more math appreciation than the trend-following masses and equities-obsessed financial sector are able to muster, but facts speak for themselves.

Hussman’s chart below plots the price to revenue ratio for the S&P 500 index from 1990 to 2021 (along the lower axis) and the subsequent 10-year annual total return (on the left axis).  Here we see that the lower the price multiple paid, the higher the returns over the decade following.  Today, with an unprecedented average price of 2.94 x revenue (see arrow), the actual return for stocks is now priced to be -5% annually for the next 10 years.  Investment markets are mean teachers for the unaware.

Posted in Main Page | Comments Off on Equities priced for negative returns for a decade from present levels