After a 4% decline for Treasury Bonds in the first quarter–the biggest quarterly loss in 41 years (as shown below in blue)–the consensus sees only more of the same. Very few expect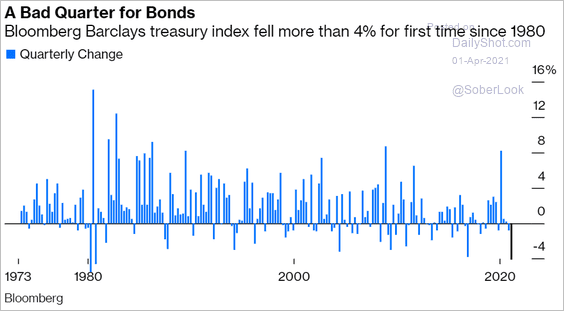 higher treasuries/lower bond yields over the next 6 to 12 months.
But actually, that’s typical. I’ve explained the inflation-bias inherent in an equity-fee-centric finance sector many times.
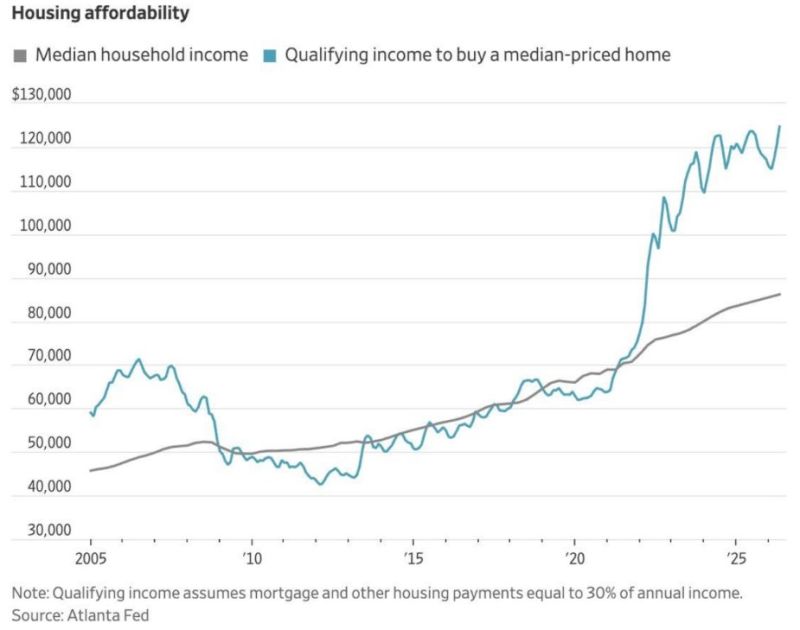
Still, as shown o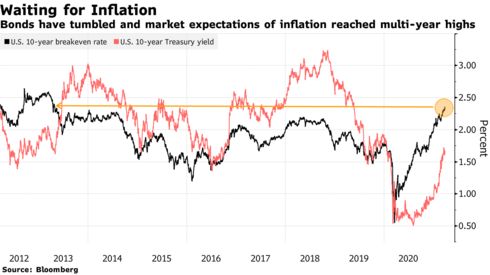 n the left, in black, inflation expectations as expressed by the US-10-year breakeven rate–the difference between 10-year Treasury Bond and Treasury Inflation-Protected Securities (TIPS)–reached the highest in March since 2012.
The Bloomberg clip below from March gives a taste of the recent consensus.
The debate over inflation is drawing new battle lines in Washington and on Wall Street. Some investors and economists think record-setting government spending will send prices rising too far, too fast, but history suggests otherwise. Here is a direct video link.
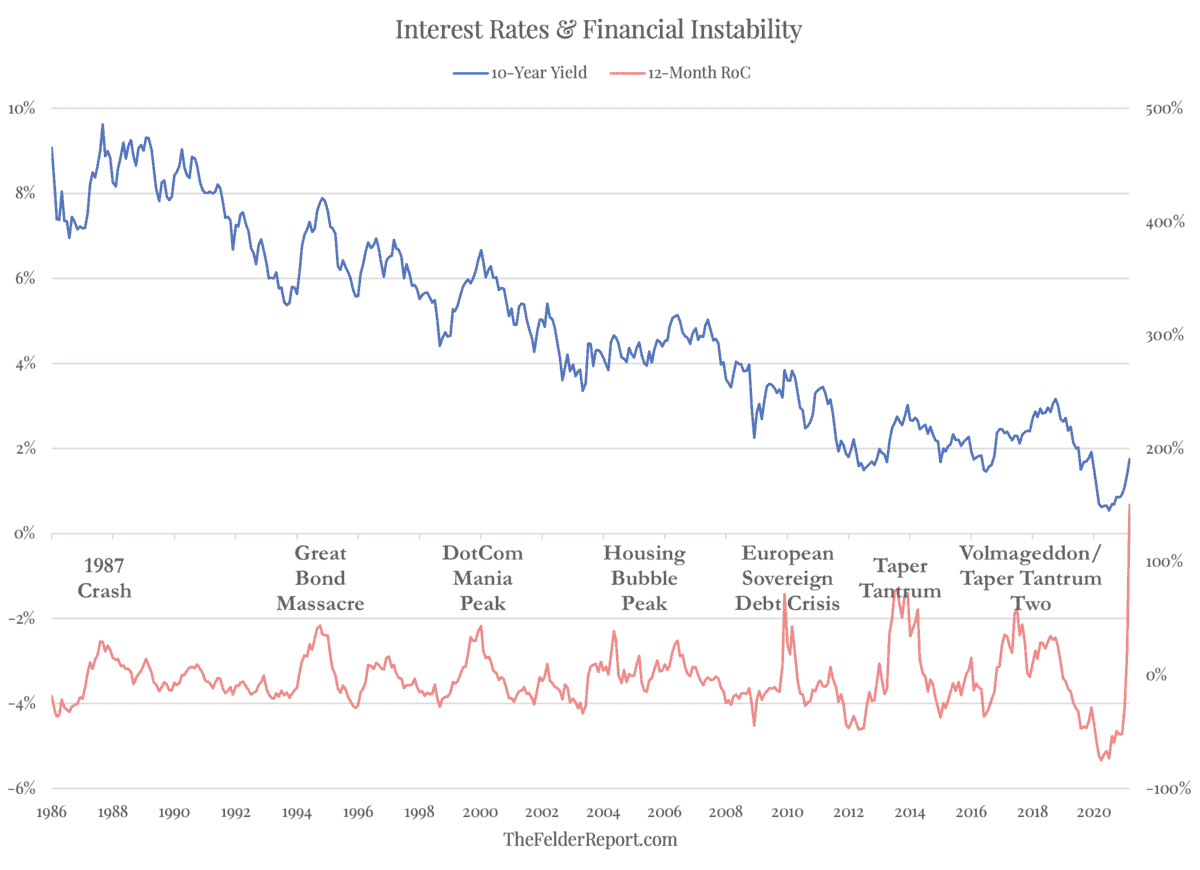
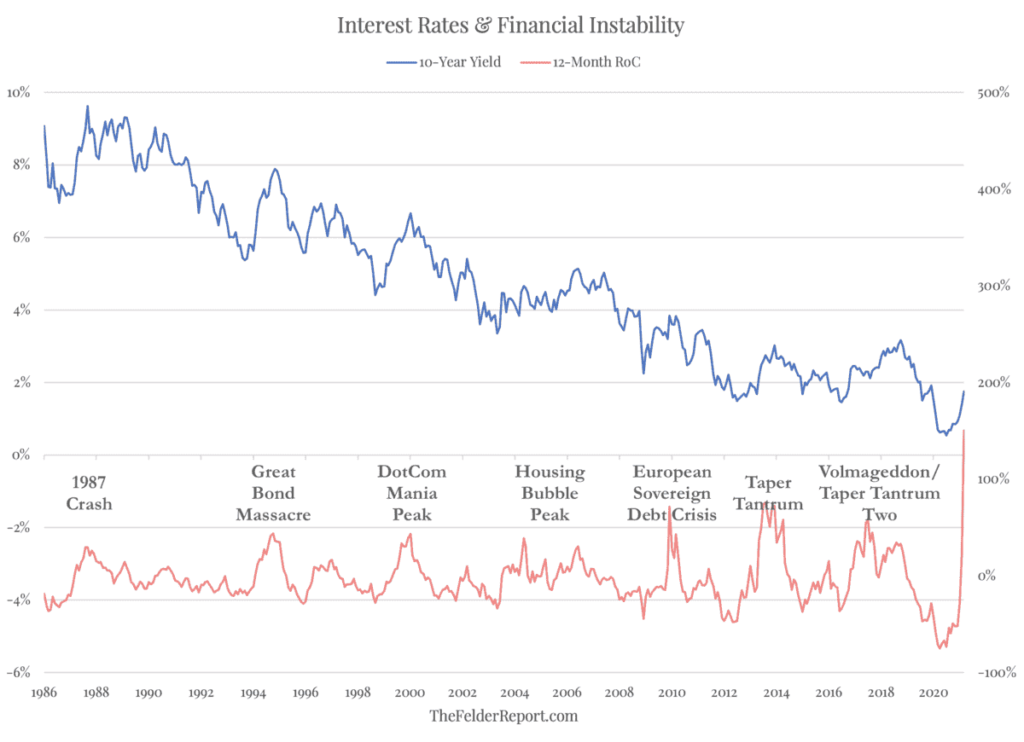
As shown below from Jesse Felder and explained in Macro, risks to the stock market are mounting; the rate of change over the past 12 months (red line below) in the US 10-year treasury yield (shown in blue) is already unprecedented. The seven much-lesser back-ups in yield since 1986 triggered episodes of instability in the financial system that prompted risk-aversion, and then more central bank ‘easing,’ followed by lower yields (higher treasury prices) once more.
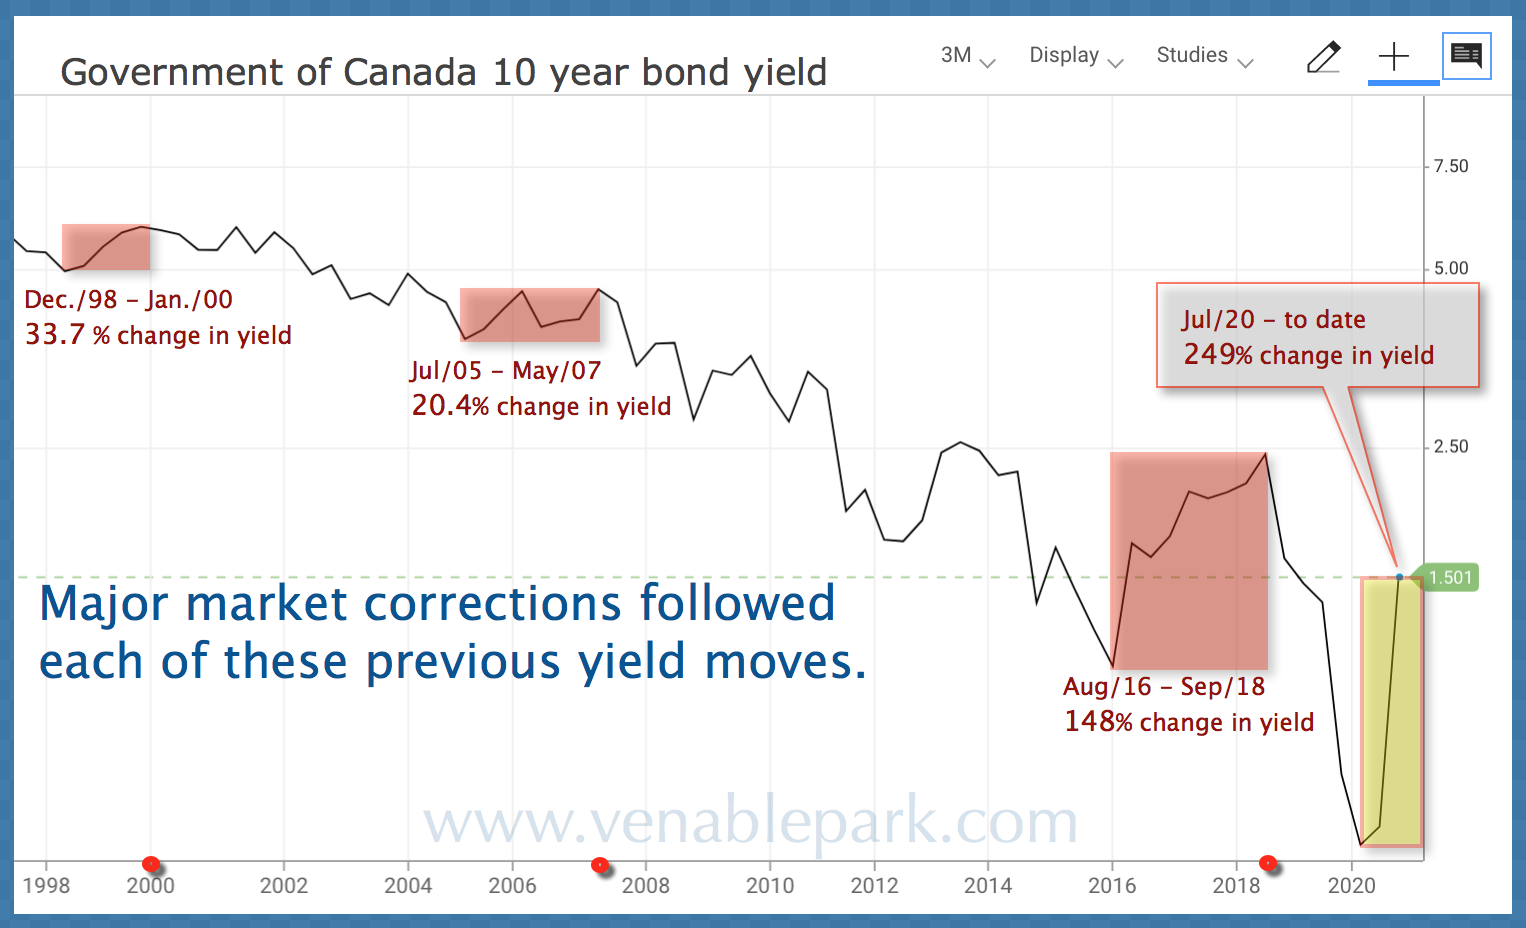
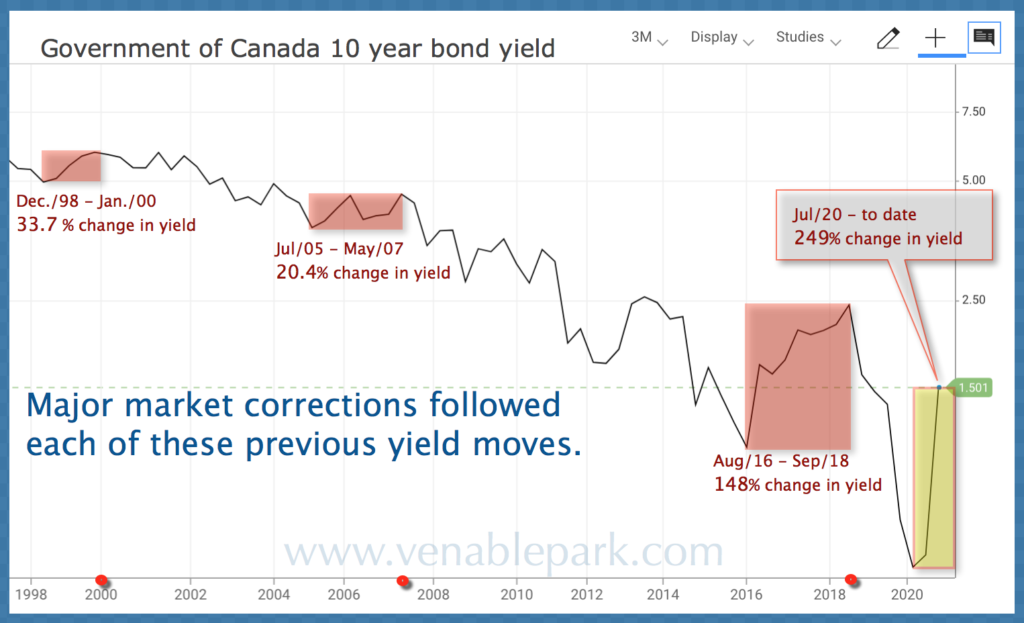
 My partner Cory Venable did a similar chart of Canadian 10-year treasury yields since 1997 below. Here, we see the three lesser yield spikes (in red) that sparked bear markets for stocks and a jump in treasury prices as risk-aversion spread like a South African COVID variant. The whopping 249% increase from July 2020 to March 2021 is marked in yellow.
 With more debt and levered risk-taking globally today than ever before, the consensus is betting that this rate cycle will be different and not prompt the next wave of financial instability and risk-aversion. Maybe, but that would be unprecedented.
Most cite federal infrastructure spending as the game-changing demand/inflation catalyst. But as we saw after the Great Recession, federal spending is much quicker to authorize than it is to get in motion at the state, provincial and municipal level, where it’s implemented after necessary regulatory studies, planning, tenders and permits. As A. Gary Shilling likes to point out, three years after federal funding was allocated in 2009, only 30% of the stimulus money had actually been spent.
In the meantime, higher yields/interest rates are weighing on a debt-soaked, income-short economy. The arm-wrestle between inflation expectations and economic reality has entered its next round.