
Danielle was a guest with Jim Goddard on Talk Digital Network, discussing recent developments in the world economy and markets. You can listen to an audio clip of the segment here.
Follow


____________________________
Danielle was a guest with Jim Goddard on Talk Digital Network, discussing recent developments in the world economy and markets. You can listen to an audio clip of the segment here.
Mortgage rates are historically average today, but too high prices and insufficient household income levels remain a problem. Welcome to a buyer’s market without buyers.
Condo sales in the GTA are down, according to the latest data from the Toronto Regional Real Estate Board, but the number of condos on the market is up. With fewer people buying property for the first time, what does it all mean for rental prices? Here is a direct video link.
Similar dynamics are evident in many places today. Nick Gerli connects the housing dots to the larger economic trends unfolding.
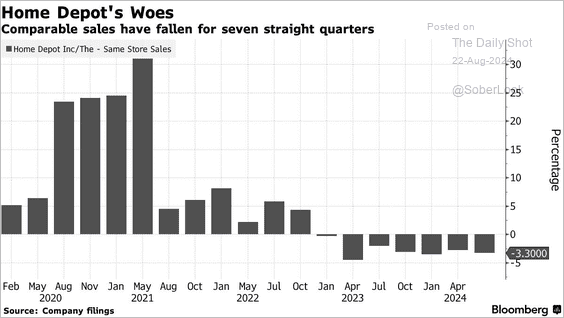
Home Depot just reported one of their biggest sales misses in years, with same-store sales dropping -3.6% YoY in Q2 2024. This is one of the biggest sales drops since the 2008-09 housing crash, and suggests that the US Economy and Housing Market is on fragile footing. Here is a direct video link.
At 35x the average of the past decade’s earnings, adjusted for inflation, the S&P 500 basket of stocks is the third most expensive since 1871 (CAPE, in blue below, versus long-term interest rates in red, courtesy of Shillerdata.com). It is pricier than at the 1929 secular peak and more than twice the long-term median of 16x earnings.
 The 12-month forward price-to-earnings ratio (PE) of 22.54x, compared with a long-term historical average of 16.5x, also suggests stocks are extremely expensive—just a little cheaper than in 2000 and late 2020. Nasdaq 100 and small-cap stocks (Russell 2000 index) are more expensive than the S&P 500, presently priced at 28.96 and 29.91x projected earnings, respectively.
The chart below shows the S&P’s annualized total return over the following decade from the different forward PE levels since 1988. Here, we can see that ratios over 23x (x-axis) were consistently followed by a negative total return over the subsequent decade (y-axis). See, Markets are way out of line with reality, according to these measures. To paraphrase Ben Graham, when valuations are rich, they offer no margin of safety, and no one should be surprised when investment returns are negative for years after that. It’s the math of mean reversion.

