North Americans: world leaders in oil production and consumption

With the world population doubling in the last 50 years, energy demands, sources and technologies are in a rapid growth phase.  It is useful to understand from whence we come.  For a detailed and balanced review of Canada’s oil history, I highly recommend Calgarian Chris Turner’s award-winning book The Patch:  The People, Pipelines, and Politics of the Oil Sands.

The chart below from the US Energy Information Administration (EIA) shows the world’s top ten oil producers with Canada at number four behind the US, Saudi Arabia and Russia.

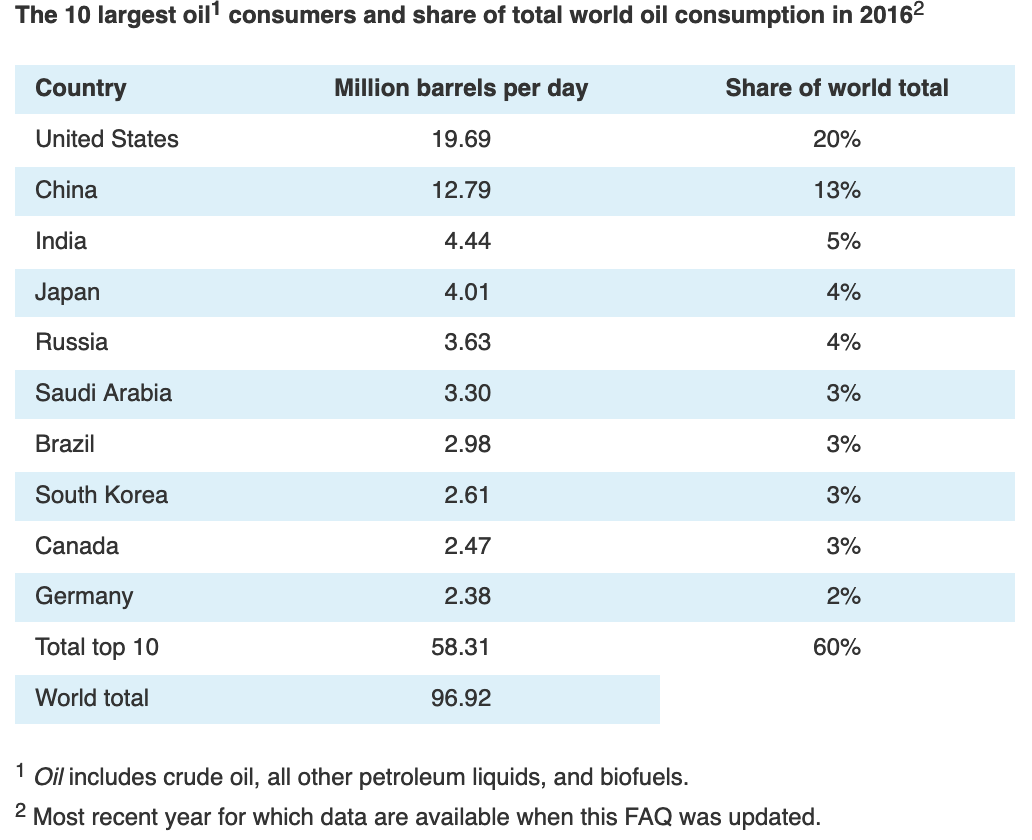
Most of all, it is important to appreciate that Americans and Canadians are world-leading oil consumers.  As shown in the table below, with 327 million inhabitants, America is by far the world’s largest consumer, on an absolute and per capita basis.  With its relatively small population of just 37 million, Canada is still 9th overall in consumption and some of the most carbon-intensive people on earth.  We have much room for energy efficiency improvements! That’s a good thing because heavily indebted Canadians are also in much need of wasting less and saving more.
The clip below on how the US has become the world’s top oil producer is also worthwhile.

The U.S. has more than doubled its crude output over the last decade. Much of the growth is due to the Permian Basin of West Texas and New Mexico. WSJ traces the hotspot of North America’s crude oil boom, with a look at challenges that producers in the region face. Here is a direct video link.

Also see The Shale Boom in the Permian is slowing down on high well-decline rates and cash burn.
Posted in Main Page | Comments Off on North Americans: world leaders in oil production and consumption

New easing cycle not bullish for corporate securities

US Fed Chair Jerome Powell stoked hopes for imminent rate cuts on Wednesday, acknowledging that global growth remains far below the Fed’s forecasts in 2019.

While large-cap shares levitated on prospects of a further reduction in borrowing rates, other economically sensitive markets like small and mid-cap, transportation, bank shares and government bond yields, are not so exuberant.  Copper prices and semiconductor sales aren’t feeling the ‘falling global demand is good’ love either.

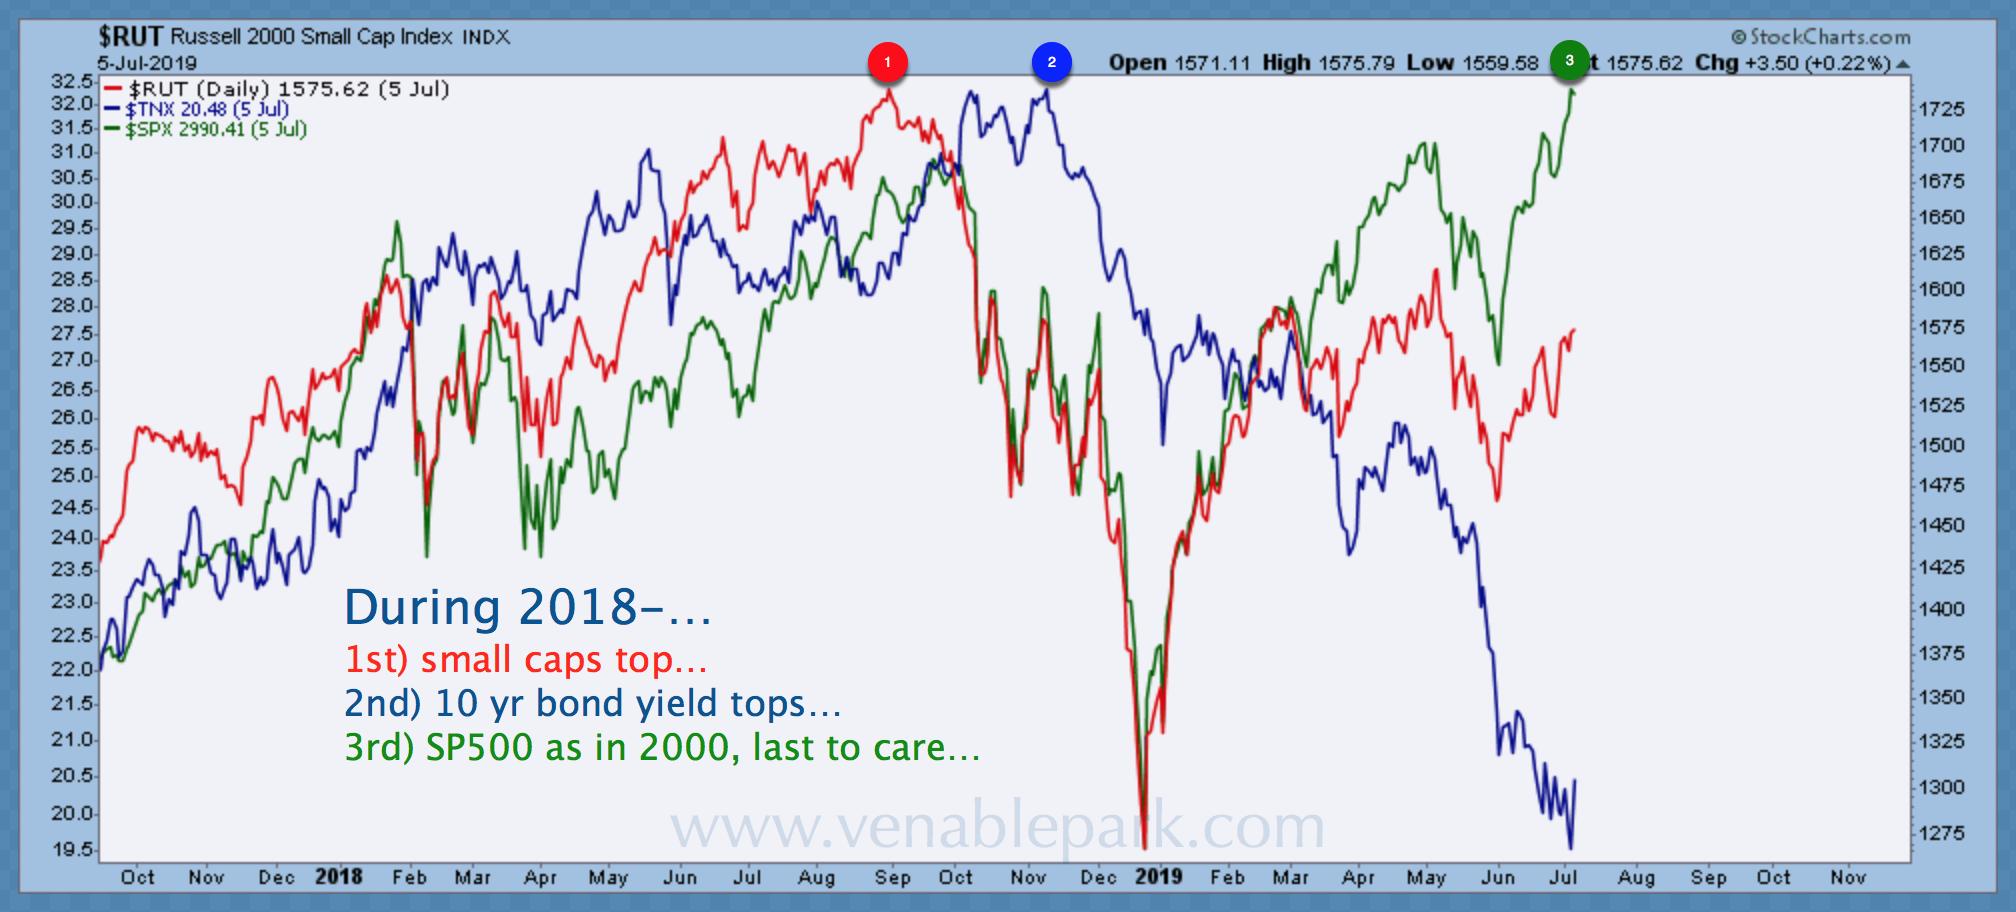
Indeed, as shown in my partner Cory Venable’s chart below, the Russell 2000 index of small-cap US stocks (in red) along with government bond yields (blue) remain well below their 2018 tops.

And as Charles Schwab chief investment strategist noted last week, since the mid-1980s, there were only two other periods (July 1990 and July 1998) when similar non-confirmations occurred between the S&P 500, transport and bank shares, and in both cases, large-cap stocks were down double-digits one-to-two months later.  The report also points out that the global Purchasing Managers’ Index (PMI) (advanced two quarters) has been falling for the last 14 months and negative revenue surprises for large-cap companies are the historical norm in such circumstances.  See  Another Last Goodbye:  U.S. stocks’ roller coaster 18 months.

Year to date, weak economic data, faith in central bank puts, and corporate buybacks, have helped large-cap stock indices recover after their 2018 meltdown.  The US Fed, aware that asset prices are the last leg of support under the highly levered economy, is once more preparing to cut minuscule rate room in an effort to keep prices near all-time-highs.  Despite its hopeful talk yesterday, the Bank of Canada will be forced to follow the Fed’s lead not long after.

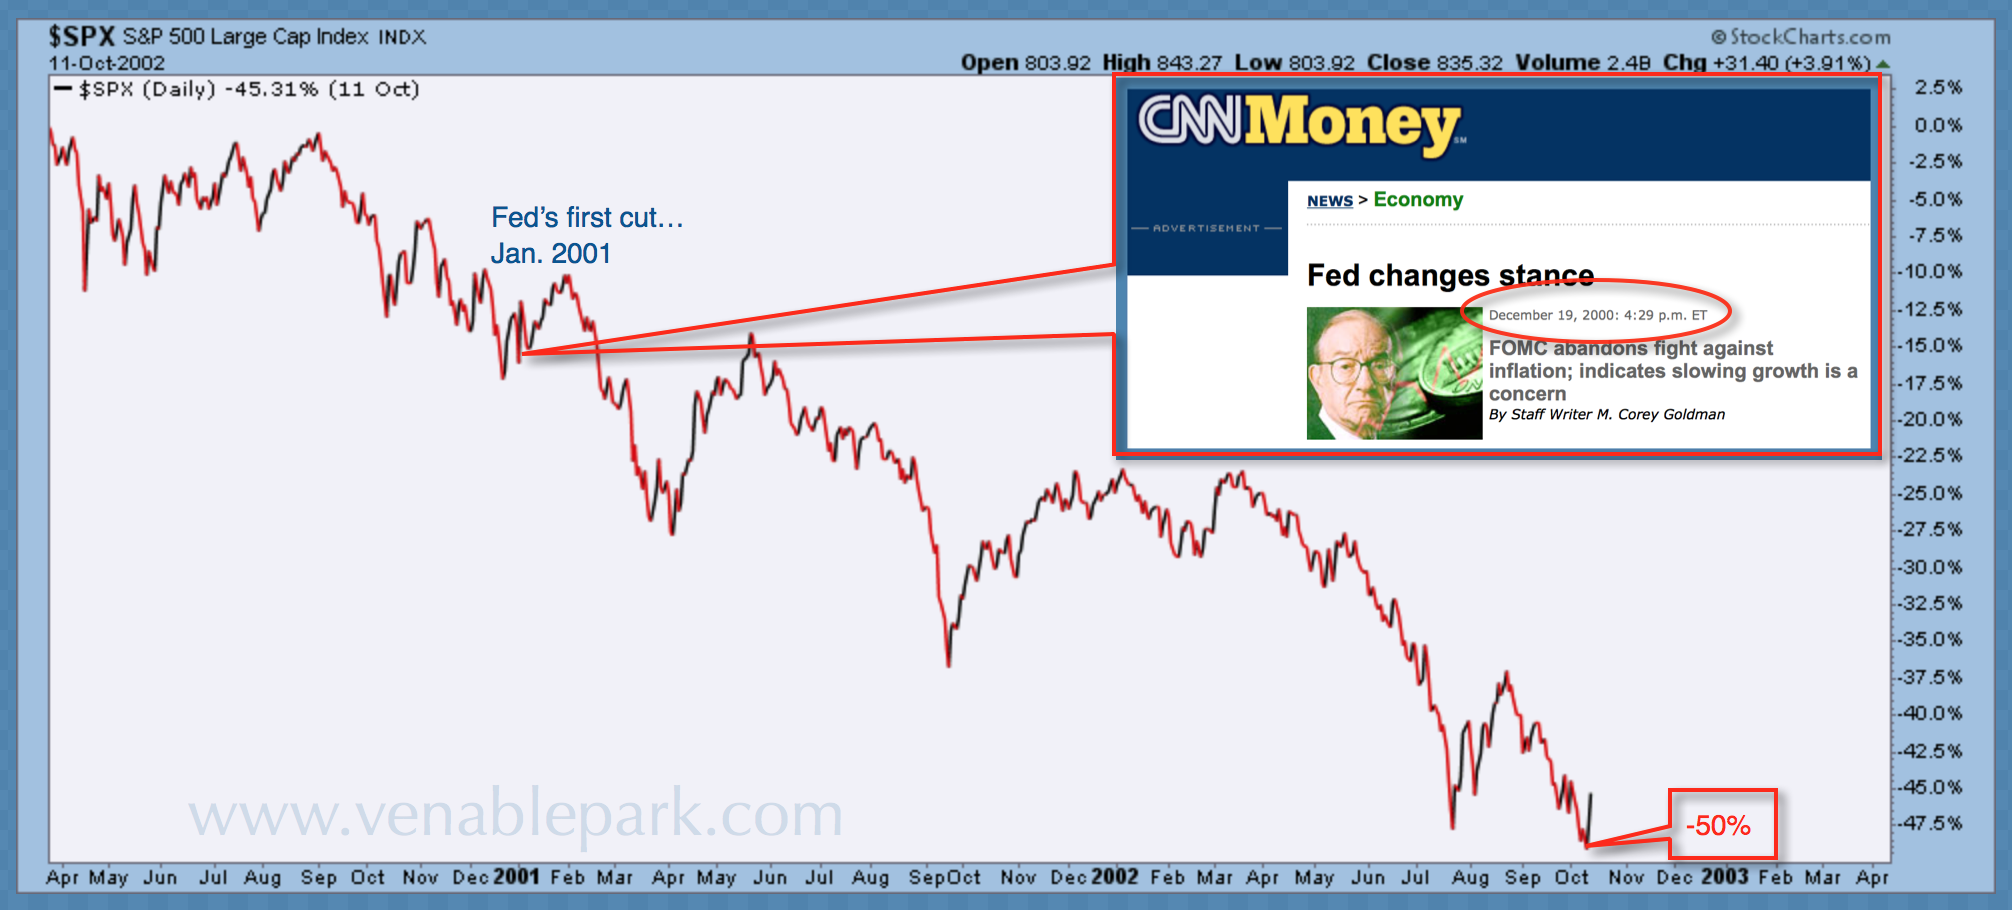
Those managing savings through this cycle must keep their eyes focused on the horizon:  protecting capital and preserving liquidity is essential if we are to have valuable buying power in the months ahead.  As shown below, in my partner’s Cory Venable’s chart, the Fed’s first rate cut in January 2001 moved from a fat 6.5 to 6% (heading into a relatively mild US recession).  The FOMC then hacked off a further 5% of rate room by June 2003, and still, the S&P 500 fell for two years before finally bottoming in 2002 50% below the prior cycle peak.


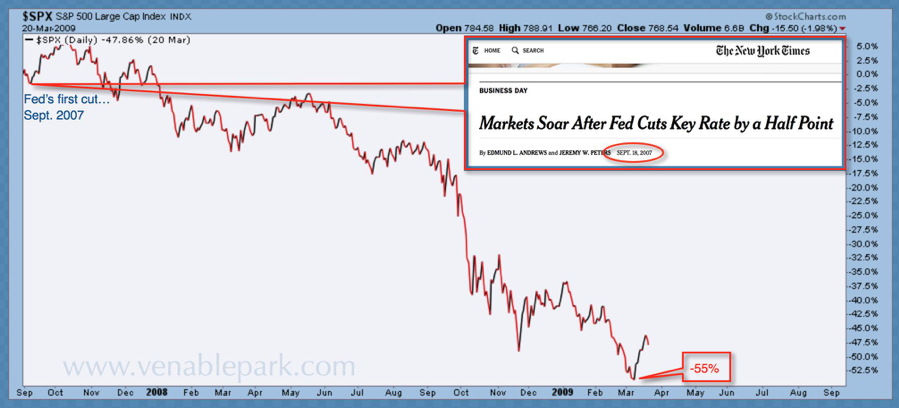
A similar pattern unfolded at the end of the 2002-07 expansion cycle (see below) when the US Fed responded to weakening data with a half-point cut from 5.25 to 4.75 in September 2007, before slashing to the zero bound by December 2008.  Still, stocks and most higher-yielding corporate bonds more than halved.

Word to the wise:  a new rate cutting cycle is not bullish for equities and corporate bonds, nor for those holding their savings in them.

Posted in Main Page | Comments Off on New easing cycle not bullish for corporate securities

Fleeting growth at the price of stability: the Fed’s conflicting mandates

When Congress passed the Humphrey-Hawkins Full-Employment Act in 1978 it added ‘full employment’ as a second and conflicting mandate to the original goal of price stability.  This seemed like a good idea to those unrealistically seeking perpetual economic expansion.  In reality, it was our present endgame in the making.

The full employment goal favored constantly rising debt-fueled consumption and inflation at the expense of longer-term stability and was eventually headed for the brick wall of nil and negative rates.  We’re there now.  With financial, political and social systems in tatters, shoring up stability is the next imperative of necessity.  Read Chris Whalen’s latest, When the Fed became a socialist job creator, here’s a take away:

Today, Fed policy as designed by progressives like Hubert Humphrey and Gus Hawkins ensures lower consumer purchasing power through inflation and gradually robs public and private institutions of even a meager return on their savings. The focus of the FOMC is entirely on consumption rather than investment and long-term growth. The Humphrey-Hawkins law neither helps employment  nor encourages long-term investment that might bolster the key ingredient of economic expansion, namely higher productivity on labor and capital.   

Posted in Main Page | Comments Off on Fleeting growth at the price of stability: the Fed’s conflicting mandates