
Yield curves offer reality check to growth bulls

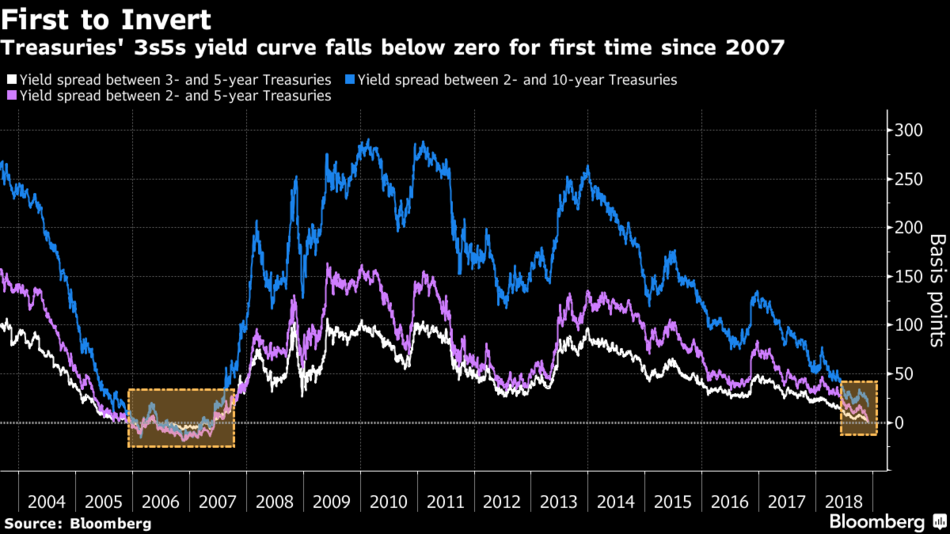
US 5 and 2-year and 5 and 3-year Treasury yield spreads moved negative yesterday for the first time since 2007, with the 10 and 2-year spread a minuscule .13 this morning. See Treasuries extend gains, after section of the yield-curve inverts.
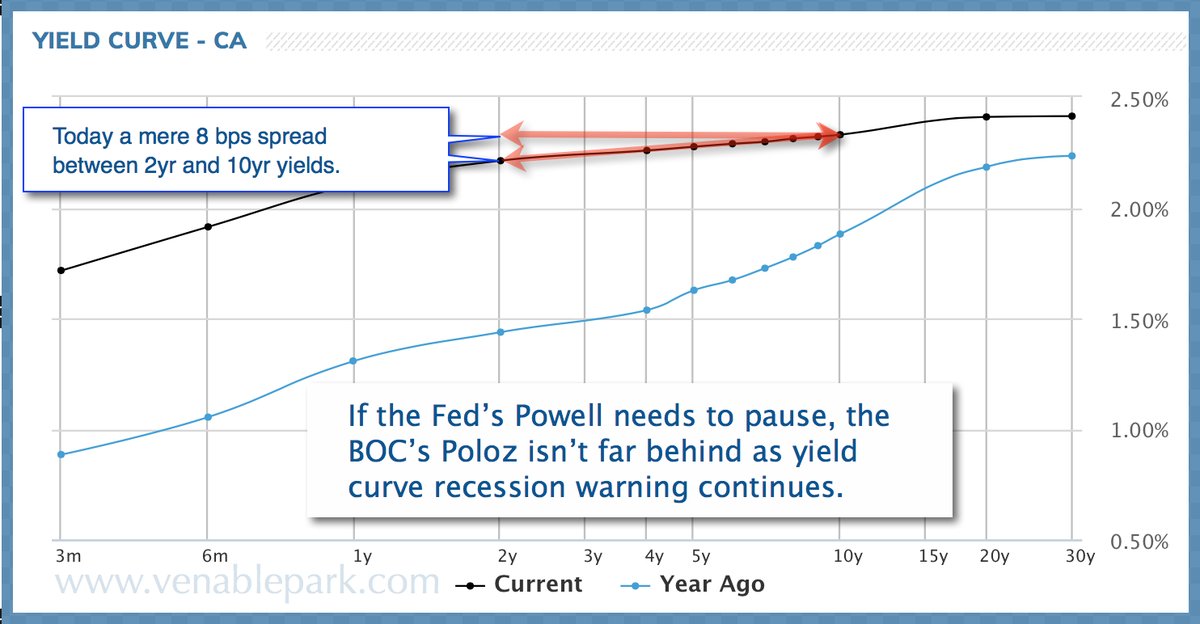
In Canada, the 10 and 2-year spread is also at a cycle low of .08 as shown here in my partner Cory Venable’s chart.

As we have been saying all year, central banks will not get as many hikes in as they hoped this cycle before the next recession overwhelms optimistic forecasts and prompts them into loosening mode once more. However, a rate pause and even further cuts typically work at a multi-month lag, which is unlikely to support equities and corporate debt anywhere near this cycle’s highs.

Indeed, as we have also noted repeatedly, the particularly precarious condition of the Canadian economy this cycle is giving the Bank of Canada (BOC) less fire room than the US Fed this cycle, making the BOC likely to pause within the next two months. Spreading recognition of this reality is putting a bid under Canadian government bonds once more, while equities and corporate debt deservedly continue to struggle. See: Traders bet Bank of Canada rate-hike pause may come sooner than the Feds.

Posted in Main Page | Comments Off on Yield curves offer reality check to growth bulls

Credit and realty prices in contraction together, naturally

Economist Steve Keen writes yesterday in Australia’s Housing Bubble Pops, that the rate of change in mortgage credit (in red below) leads the level of house prices (blue), as shown here in America since 1990, with the 2006-09 collapse in both readily apparent.

While Australia and Canada boasted a record surge in home prices over the decade since the Great Recession, this also came with the commensurate surge in mortgage credit, and  as shown below for Australia, both credit and prices are now following their natural path lower over the past year.
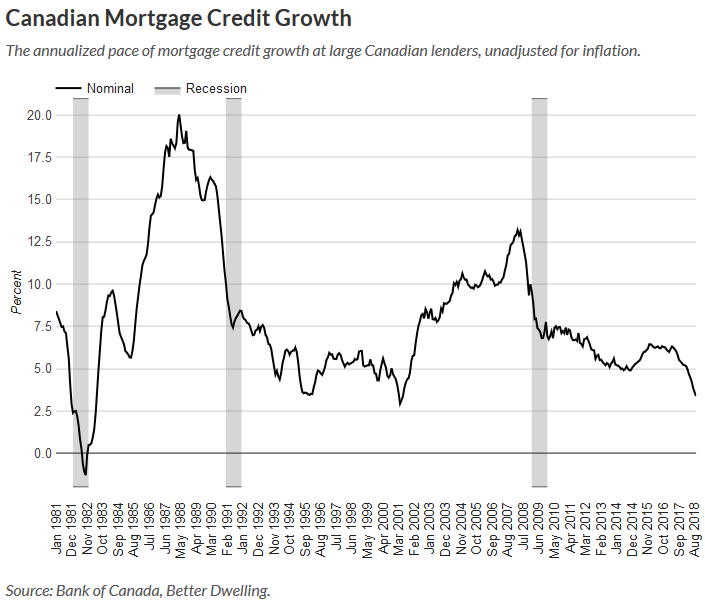
This is forboding for Canada as well, where property prices have also been softening and credit growth has turned sharply negative over the past 18 months, shown below since 1990. (Adjusted for inflation, this credit contraction has been much sharper). Similar drops marked the onset of the last 3 Canadian rescessions (grey bands), as well as a halving of the Canadian stock market in 2000-03, even though no official Canadian recession was recorded.

Posted in Main Page | Comments Off on Credit and realty prices in contraction together, naturally

Canadians under-saved and unprepared for slowing economy

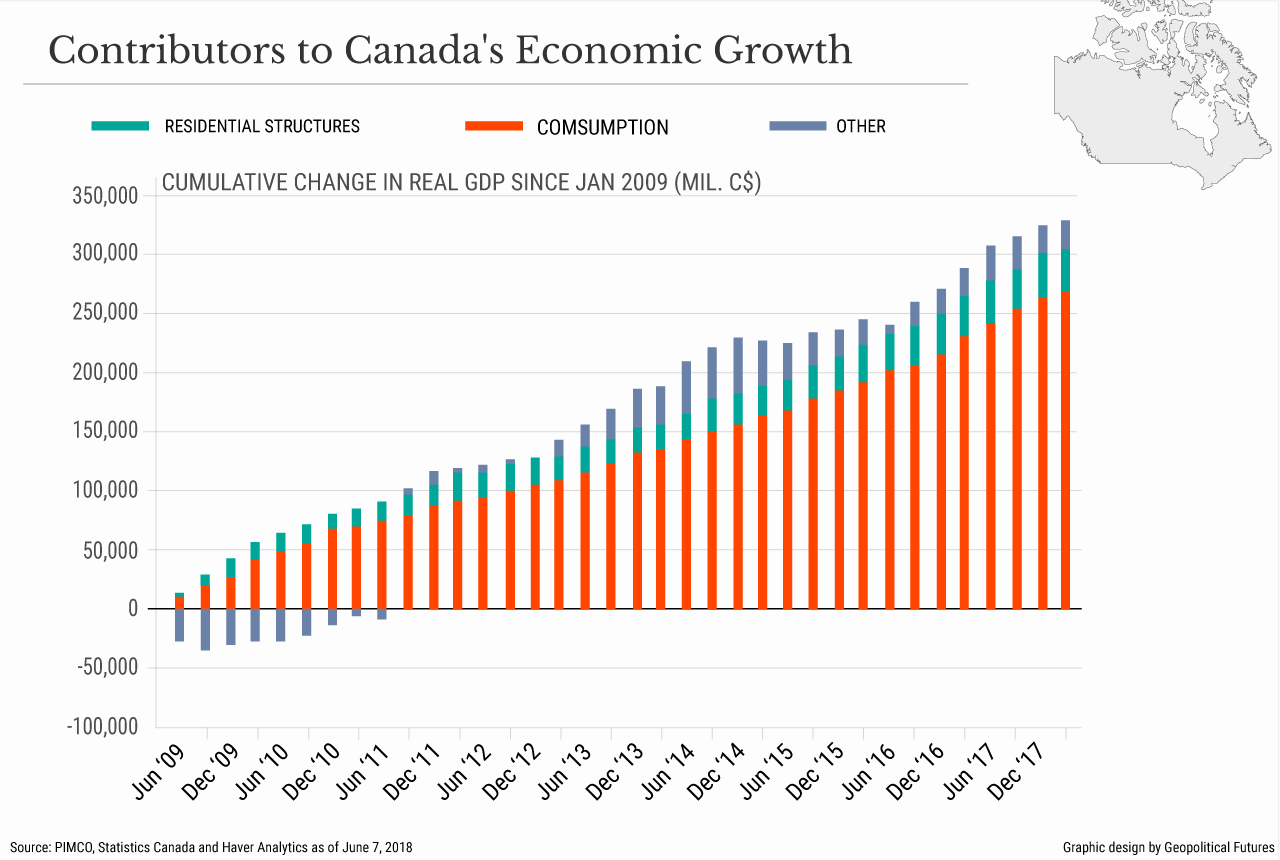
Some 90% of Canada’s economic growth since the last recession has come from household consumption and spending in the realty sector (see chart below), enabled by unsustainable growth in debt at every level of the economy.

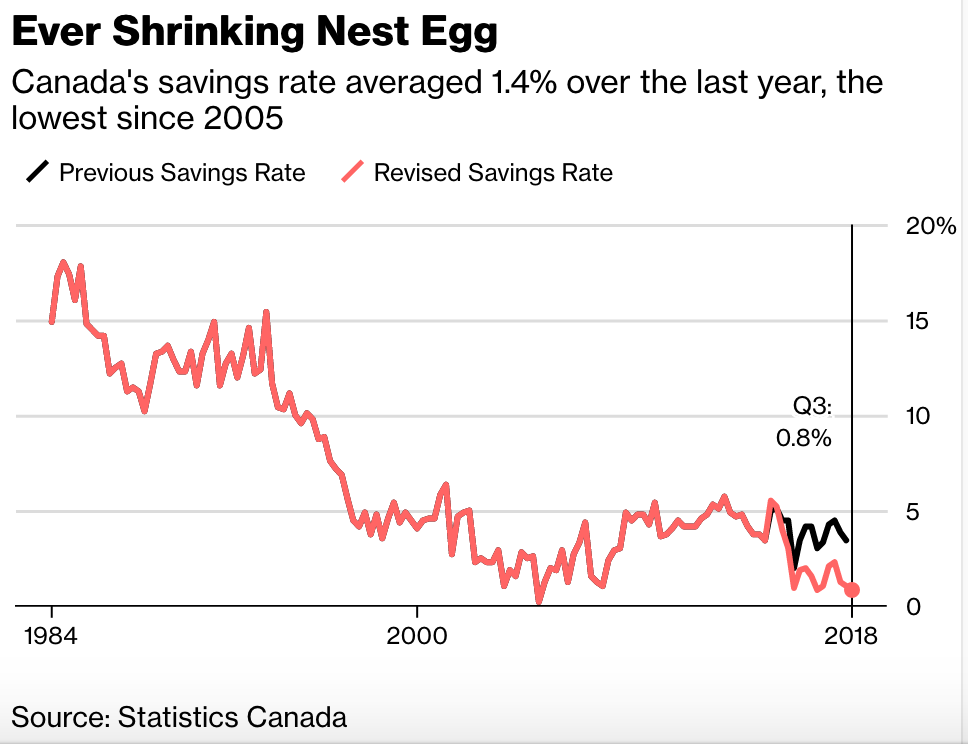
In the process, Canadians dramatically reduced their savings for rainy days and future needs like retirement and their children’s education, moving from 10 to 15% of disposable income before 1995, to less than 5% over the past 20 years, and a pitiful 1.4% in the latest 12 month period (as shown below).   See:  Canadians aren’t saving much of their paychecks for a rainy day.
One might expect that the second longest economic expansion since World War II would have bolstered financial strength over the last decade. Unfortunately, because it was enabled by ‘easy credit’ and malinvestment–it has had the opposite effect, making households and the nation now extra vulnerable to retracing realty prices and a slowing global economy.

All of this proving once again that smooth waters do not build the best sailors.  It has been wisely said that a crisis is a terrible thing to waste.  We should hope to learn better financial management skills from adversity in the next phase.

Posted in Main Page | Comments Off on Canadians under-saved and unprepared for slowing economy





