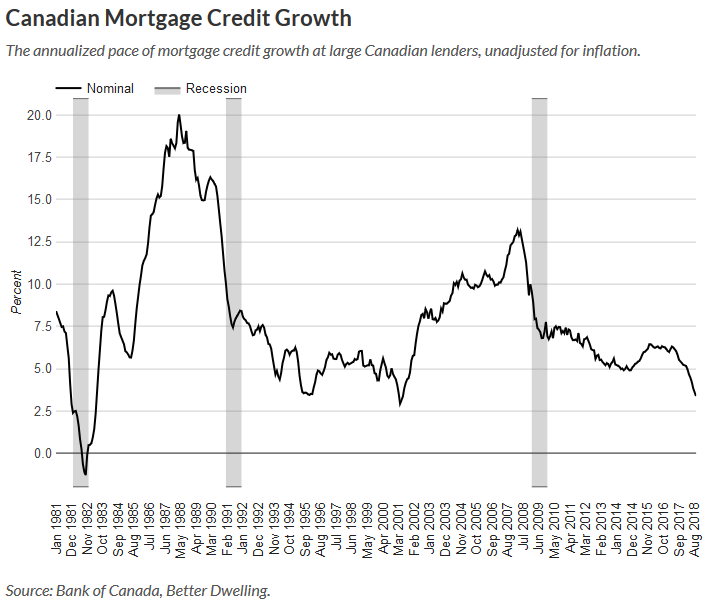
As we suspected it would, the Bank of Canada paused this morning in its rate-hiking aspirations, leaving the overnight rate at 1.75%, while noting in their press release slowing global demand, sharply lower oil prices, negative business investment, along with slowing household credit and weaker regional property markets. At the same time, consensus expectations for a hike at the next January 9th meeting have fallen to less than 50% this morning.
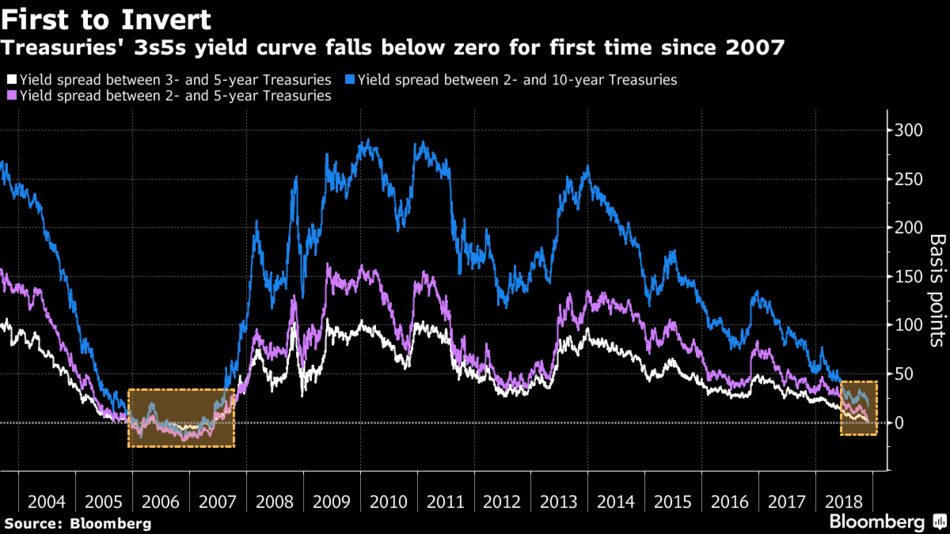
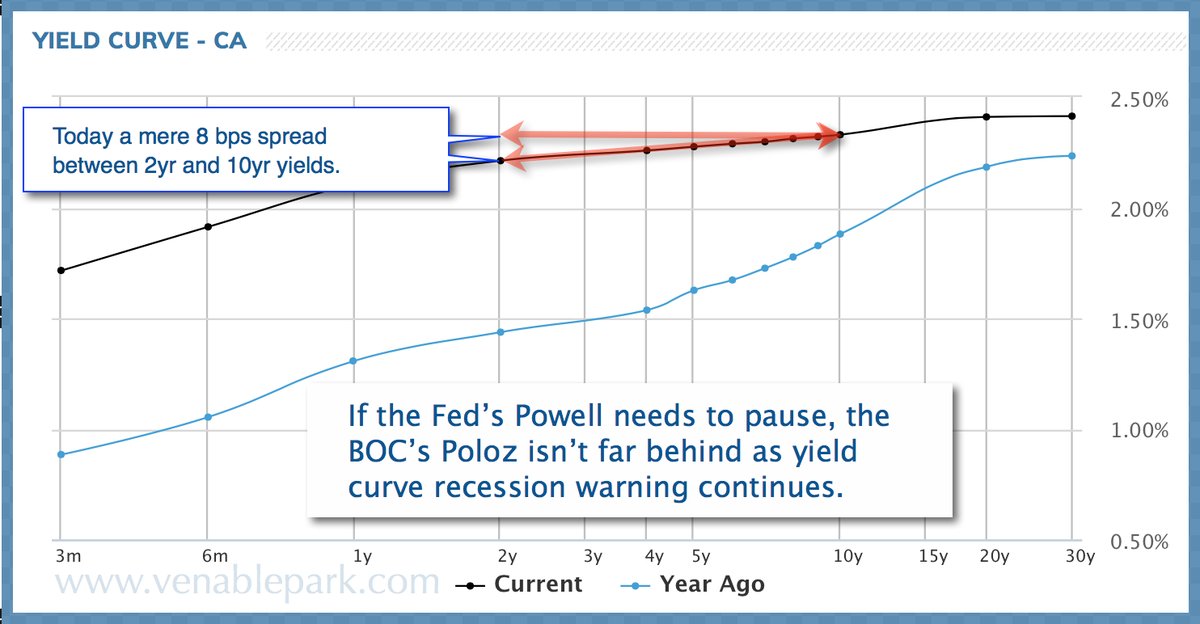
In response, the Canadian dollar slumped a further .93% against the US dollar–down 6.3% year to date–and Canadian government bonds are rallying. With the Canadian 10-year yield backing down to 2.12%, there’s a scant .07% spread today between it and the 2-year treasury yield–a fresh cycle low, reflecting the slowing outlook for Canada.
With US markets closed for the day, the Canadian stock market is mildly positive, but negative year-to-date, and the global market mood is decidedly ‘risk off’.
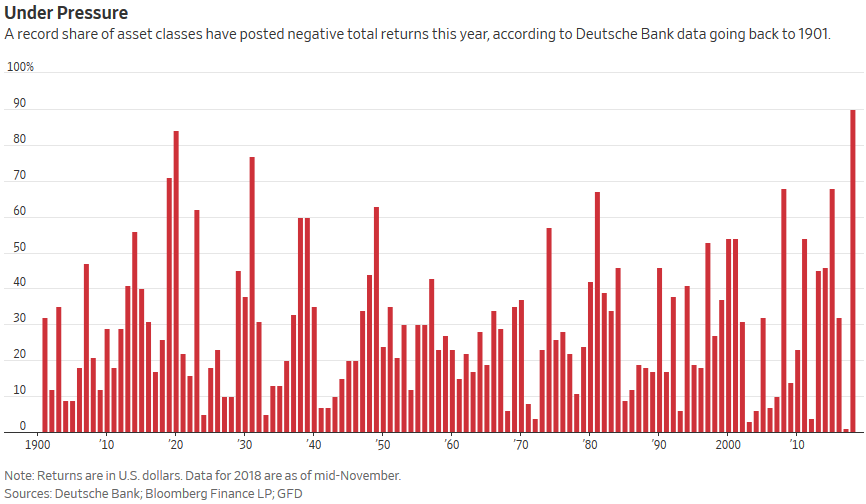
As shown below since 1901, a record 90% of asset types have posted negative total returns in 2018 (including income), and this long overdue ‘correction’ phase is only just started. Speculation-gauge-cryptocurrencies continue melting, with pack-leader Bitcoin breaking to a fresh 2018-low below 3700 this afternoon.
Those with a proven value investment discipline have been tortoises in a race with QE-juiced-hares the past five years. But each full-cycle race is measured from trough to trough, not trough to peak. Only in the next market bottom, will we finally see who has what capital to show for the last decade of effort. The most historically relevant markers confirm that seemingly endless ‘easy money’ made hares extra reckless this time around.
As usual, perma-bulls hope that monetary magicians will save irresponsible risk-takers from just desserts. However, what I wrote in Bank of Canada ready to hike or blink? last September remains relevant to Canada, and most of the world today:
“With the madness of King Trump to our south, and a host of counter-productive policies undermining strength and stability in the free world at the moment, wage growth for the masses is going to continue to be elusive in Canada. The BOC can talk big on monetary policy, but at this point, they are carrying a minuscule stick. Canada has earned itself an extended rough patch and most Canadians don’t see it coming.”
While most will suffer from poor and non-existent preparation, pain is not impossible to avoid. Those with a financial plan to protect and even grow capital through the rough laps will find that patience and personal discipline are back in the lead once more.
 While Australia and Canada boasted a record surge in home prices over the decade since the Great Recession, this also came with the commensurate surge in mortgage credit, and as shown below for Australia, both credit and prices are now following their natural path lower over the past year.