In 25 years as a lawyer and financial analyst I’ve prepared and reviewed lots of income and expense statements, for businesses and households, across all income brackets. Early on I noted that in terms of financial strength, the level of expenditure is far more definitive than the level of income.
When there are lots of holes in our bucket, even huge amounts of cash flow will keep running out. When there is attention to efficiency and fiscal restraint, even relatively low amounts of income can build strong financial foundations over time. Personal discipline is key.
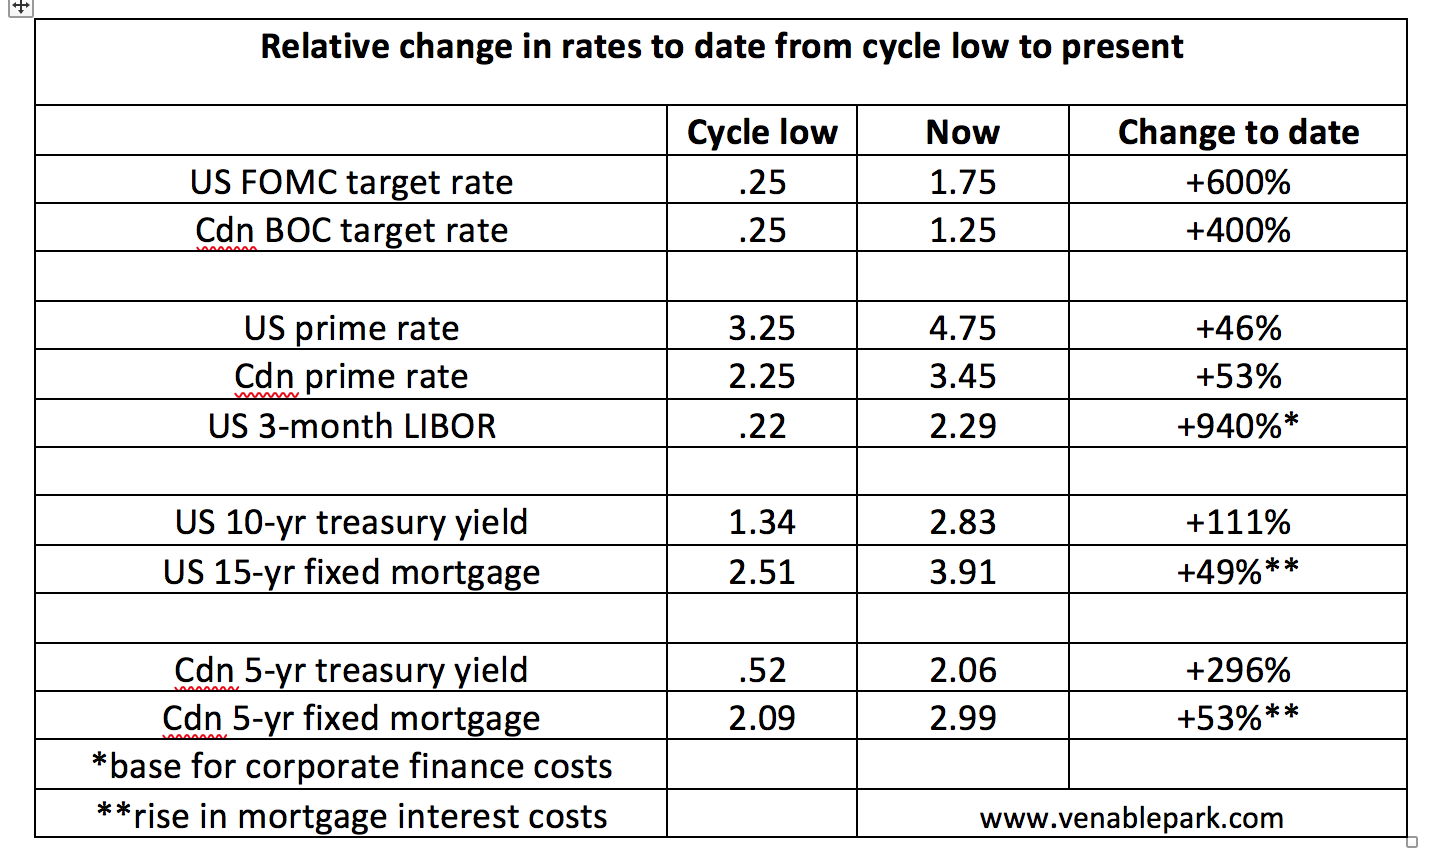
The last few decades of easy and easier credit–as interest rates fell and financialization boomed since the early ’80’s–have been the bane of financial strength. Rather than saving first to spend later, credit enables us to spend first and then pay back a larger expenditure (with financing costs) over time. In the process, expenses increase and the amount of cash flow left over for savings is reduced or eliminated altogether.
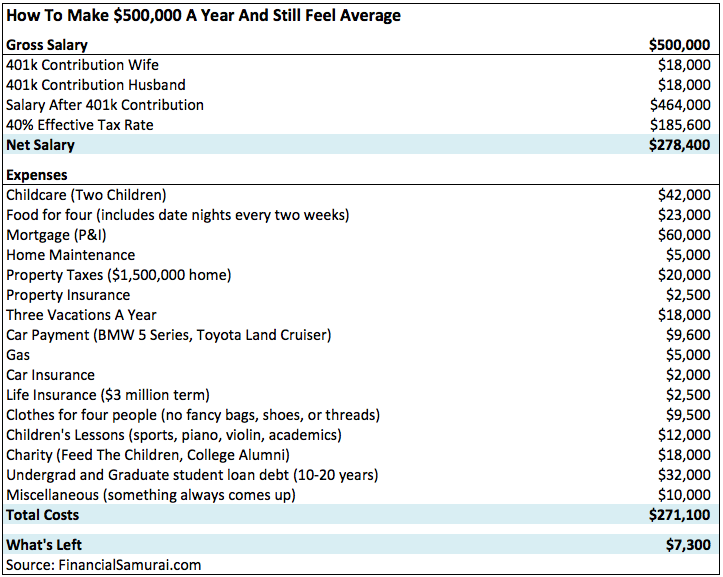
Recently I came upon this CNBC article that included the budget of a US couple earning $500k a year and barely covering their outflows, while saving 7% of their gross income per year. The breakdown offers a good case study.
 Off the top, it’s important to note that $500k in annual household income is huge. Consider that to leave these jobs, and retire on 500k a year in investment income at today’s yields, one would need just under $17 million in savings.
Meanwhile, the median annual household income in the US was $59k in 2016, and $70K in Canada. The Pew Research Center defines ‘upper class’ households as those earning more than 2 x the national median income ie., more than $118K in the US and $140K in Canada. In either country (indeed the world) less than 1% of households have an annual income of $500k and more.
With the median annual savings rate nationally at less than 3% today, this household saving 7.2% of their income per year is socking away just over twice the national average. But with income more than 8 x the national median, the question should be why are they saving so relatively little?
Standouts are the usual suspects: financed expenditures like a $1.5 million shelter (plus taxes, insurance and upkeep), three cars (with gas, insurance and maintenance), student loans, and lifestyle items, like three vacations a year.
It does not say what their outstanding debt balances are, but it’s difficult to get to meaningful savings ratios until debt is fully retired. So, after tax deductible retirement saving contributions (sometimes even before them depending on tax rates) focus number two should be the debt. To make meaningful headway, the family needs to reduce their spending so they can eliminate debt, and then redirect the cash flow to monthly savings.
The most obvious place to start would be downsizing three cars to two or even one. Change light bulbs to LEDs, cut cable, do more of your own jobs around the house. It’s amazing what costs we can drop when we focus minds on it. I would also look to cut the vacation budget; still take time off, but find cheaper options for recreation.
Lastly, especially when you’re still in debt and raising kids, charity has to begin at home, $1500 a month (18k a year) is a ton to be giving away at this stage.
When bank deposit rates were over 18% in the 1980’s, credit costs were high and households were debt-averse and saving more than 15% of their income per year. We need to get back to those habits.
If we can be serious about lowering expenditures now, eliminating debt and building up liquid savings again, the future will be brighter with less stress and more peace. Households will be stronger, health and social systems, less strapped. Magic.