Bond bear due for hibernation in 2018?

Tax cuts and hope for accelerating economic growth, inflation and interest rates in 2018, have rendered an even wider than usual consensus that treasury prices can only go down from here.  January did see a further sell off in government bonds and gap higher in yields. And this did increase the cost of borrowing for consumers, business and governments alike, and there in lies a rub. With the world more indebted than ever before, and much worse than in 2008, rising rates crimp already tight cash flows.

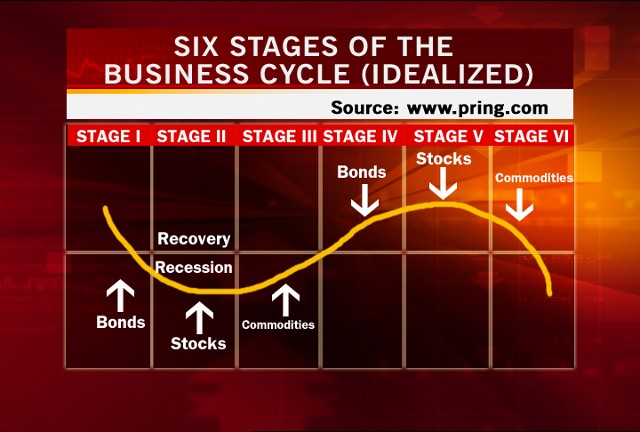
It’s also the reason that bond prices typically fall first at the top of each credit cycle as monetary conditions tighten, and are then soon followed by deflating stock and commodity prices.  (See The valuation cycle strikes back) for more.

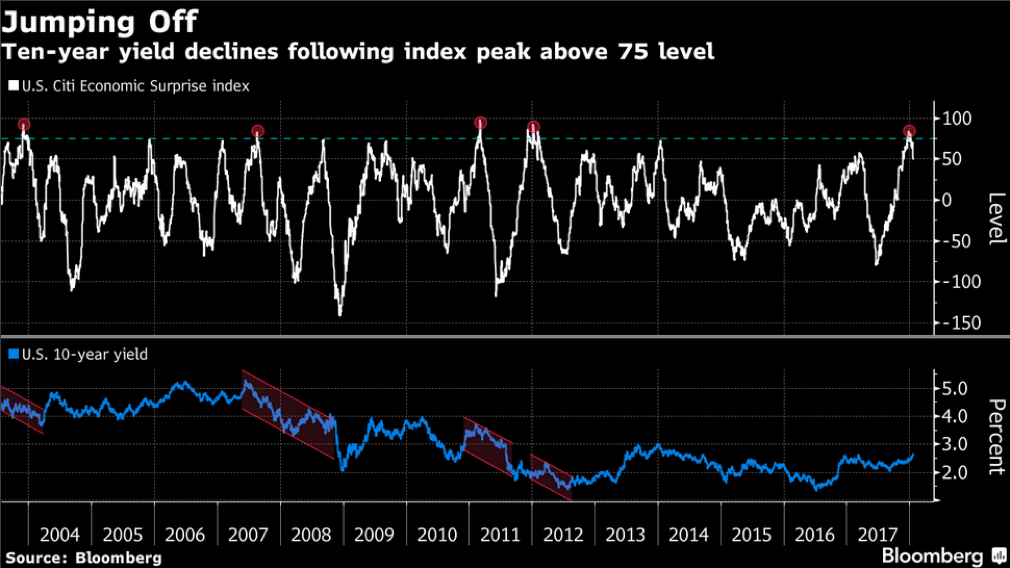
When credit cannot get any looser, employment, income and ‘upside surprise’ any better, then spending retreats, the economy weakens, everyone looks to central banks for more slack and ‘safe-haven’ treasuries are bid once more.  The below chart of the US economic surprise index (in white) and the US 10 year Treasury yield (in blue) since 2003, shows the pattern.  When the upside surprise index tops 75, good news has been over-priced and disappointment and falling treasury yields are due.  See: Markets are about to get ugly according to these charts.

December was only the fifth time since 2003 the economic-surprise index peaked above 75. From each peak to the corresponding trough, 10-year yields on average dropped 1.11 percentage points over the next seven months, according to data compiled by Canaccord. Bonds have yet to respond to recent disappointing data, as the 10-year approaches the 2.66 percent high watermark set in 2014.
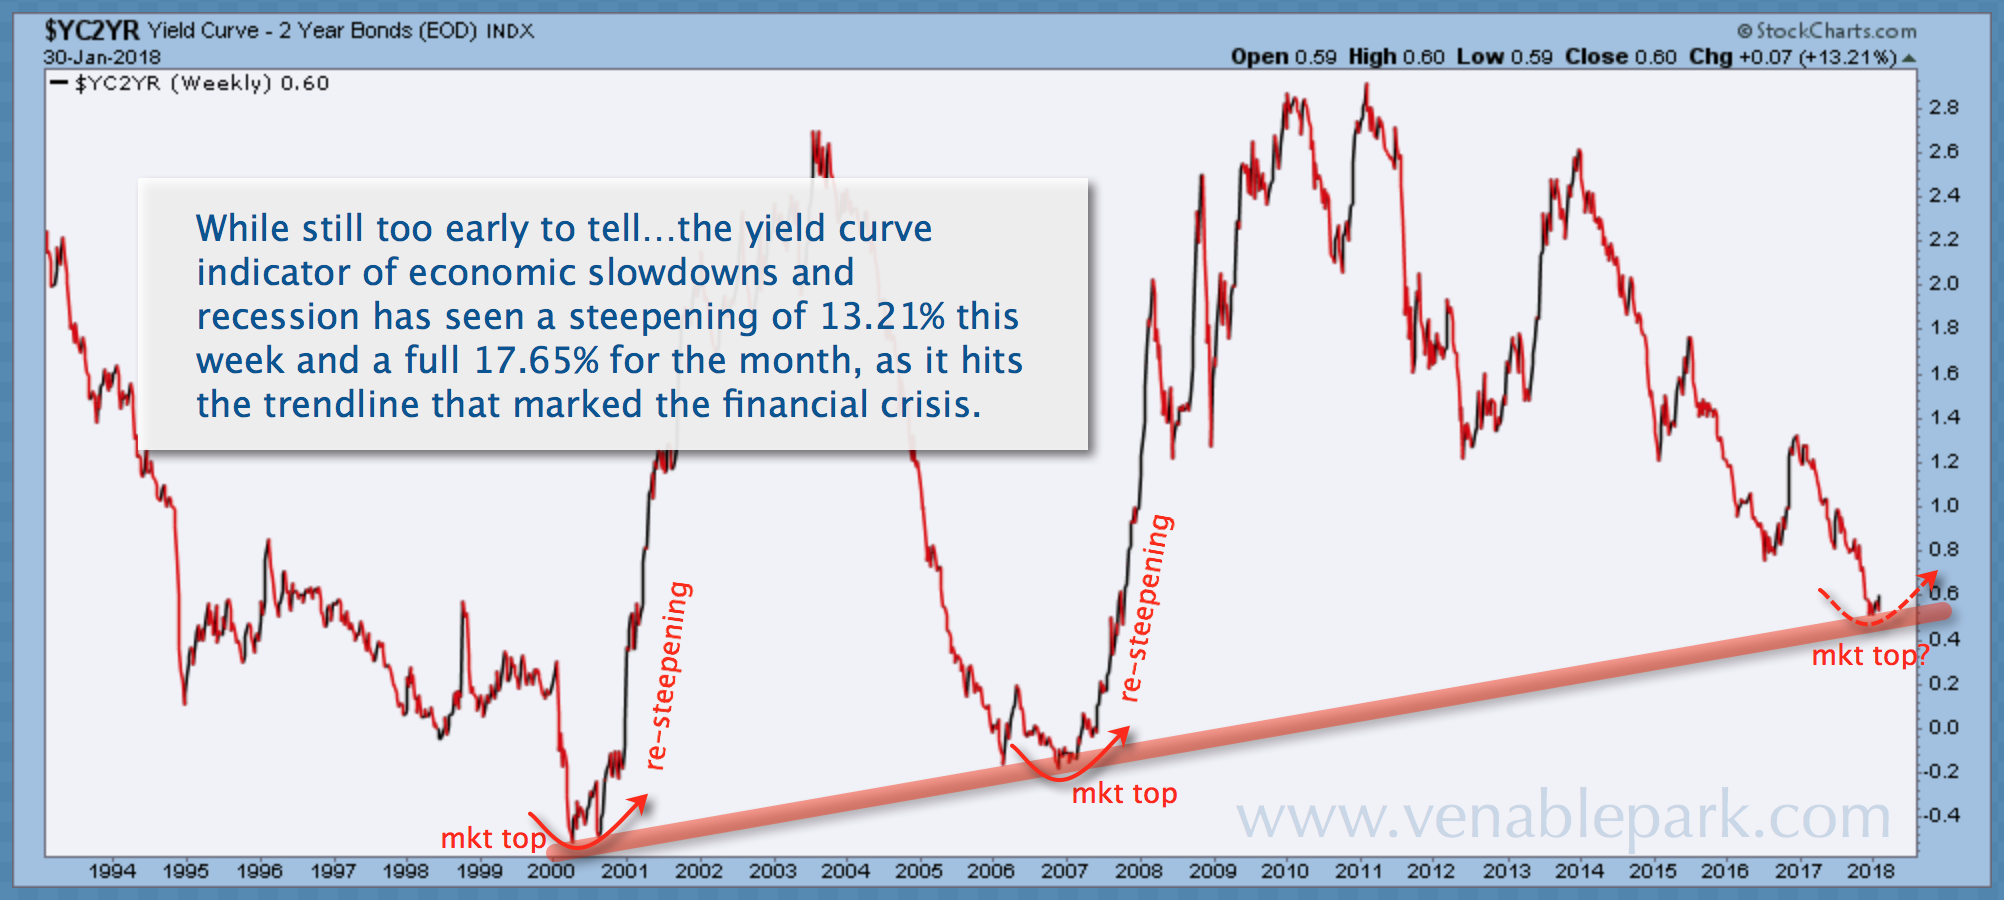
If disappointing economic activity now prompts central banks to hike rates less than they have planned (hoped), and 10-year treasury yields begin to fall (bond prices rise) over the next several months, then, as charted below by my partner Cory Venable, we may also be at the end of the equity market expansion cycle as in 2000 and 2007.  Then as now, of course, hardly anyone is prepared for that.
Posted in Main Page | Comments Off on Bond bear due for hibernation in 2018?

The valuation cycle strikes back

In the final stages of every market cycle, asset classes that have gone up on excess liquidity, leverage and speculative fervor, come down together all around the world.  As screens of red in global financial markets attest this week, historic correlations remain alive and well today; probably never more so. Yes, cryptocurrencies too.  Portfolio diversity foiled (thanks central banks!).
Moreover, this particular expansion cycle since 2009, now has the distinction of being the most over-inflated in history.  As explained and numerically demonstrated by John Hussman this week in Measuring the Bubble:

“Last week, the US equity market climbed to the steepest valuation level in history, based on the valuation measures most highly correlated with actual subsequent S&P 500 10-12 year total returns, across a century of market cycles. These measures include the S&P 500 price/revenue ratio, the Margin-adjusted CAPE (our more reliable variant of Robert Shiller’s cyclically-adjusted P/E), and MarketCap/GVA – the ratio of nonfinancial market capitalization to corporate gross value-added, including estimated foreign revenues – which is easily the most reliable valuation measure we’ve ever created or tested, among scores of alternatives… now stands beyond even the 2000 market extreme.

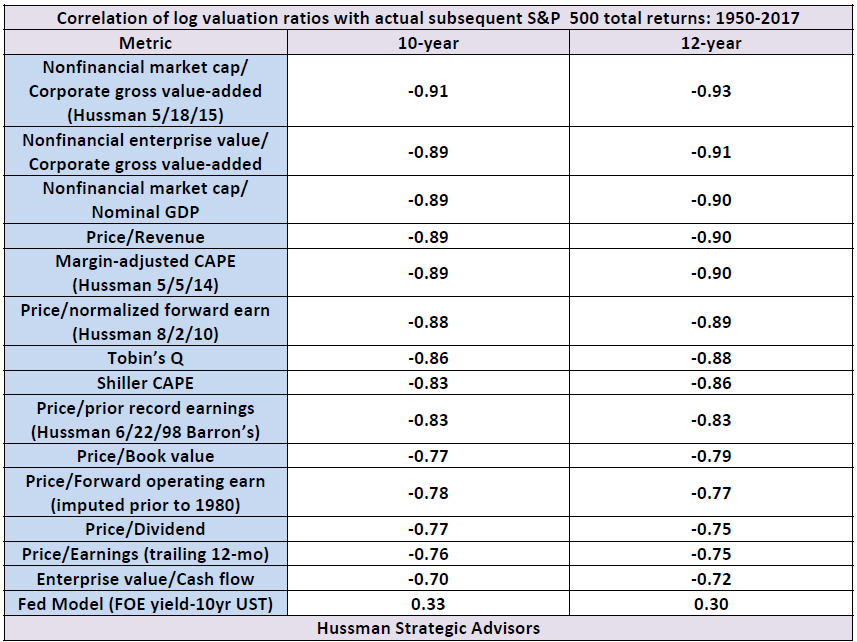
Hussman offers a user-friendly table of the 14 most historically reliable stock valuation measurements and their formidable (70-93%) negative correlation with S&P 500 returns over the following 10 and 12 year periods.  The bottom entry is the so-called ‘Fed Model’ ratio which has a positively useless +.33 correlation with subsequent market returns (no wonder central banks never see downturns coming, they are paid to look at the wrong measurements, literally.)


For all the people who are either ignorant about the significance of valuation cycles or have convinced themselves that they no longer matter in the brave new world of record leverage and speculation,  the coming mean reversion will offer yet another teaching moment.

With the most reliable stock valuation measures now 300% above long-term averages, the depth of mean reversion coming is already ‘priced in’ with a loss cycle likely to be larger than the 50% declines of both 2000-02 and 2008-09.  Believe it or not. This matters, because for all the record rebound in US stocks since 2009, a 60% decline would wipe out every bit of fantasy ‘total return’ (see Fun with S&P 500 snakes and ladders) since December 1999.

That’s how secular bears fulfill their extreme valuation destiny of 18-20 years with wild swings and zero net returns.  And with stocks back at the same and worse valuation extremes as in 1999, they are once more priced to spend the next 10-12 years with negative returns; longer still trying to grow capital back to present levels.  For those needing to take income withdrawals to live over the next couple of decades, the compound loss numbers from here will be much worse.  The time to take defensive action is before the downcycle begins.


Posted in Main Page | Comments Off on The valuation cycle strikes back

Danielle on This Week in Money

Danielle was a guest on This Week in Money with Jim Goddard, talking about recent developments in the world economy and markets.  You can listen to an audio clip of the segment here.

Posted in Main Page | Comments Off on Danielle on This Week in Money