How much life savings should we bet on a ‘GOAT’?

Today on CNBC, Mike Santoli reviews the stats on the 2009 to 2018 stock market expansion and points out that, already the second largest and longest price expansion in history, Bulls are now betting this market will be the G.O.A.T (Greatest of all time) and manage to match the all time largest speculative price to earnings peak reached at the tech-bubble top of 2000.

Meanwhile in terms of price-to-sales, Leuthold Group notes that the S&P 500’s price-to-sales ratio today is already above where it was at the year-2000 market peak.

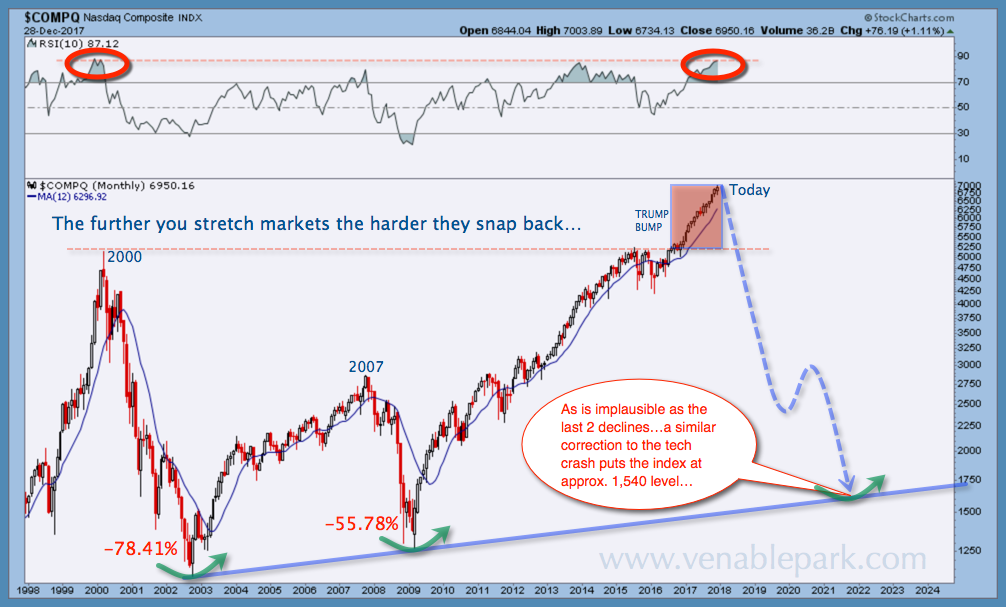
Everyone with a financial memory should know what happened next.  The below chart of the NASDAQ 100 Index since 1998, by my partner Cory Venable, is a reminder.  Not only did the NASDAQ collapse 78% into 2002 and the broader markets 50%, but it then took 16 lost years and trillions in central banks QE injections for the index to make back losses.  By then, most of the people who were holding in 2000 had long since liquidated in losses.  The rebound and Trump-bump extension since 2016, has now set stocks up for a similarly severe mean reversion period in the next contraction period (suggested by blue dotted line back to cyclical support).  On a monthly, relative strength indicator (RSI), the NASDAQ is as overbought today as it was in March 2000 (see red circles).  Truly, it’s hard to be hyperbolic here.
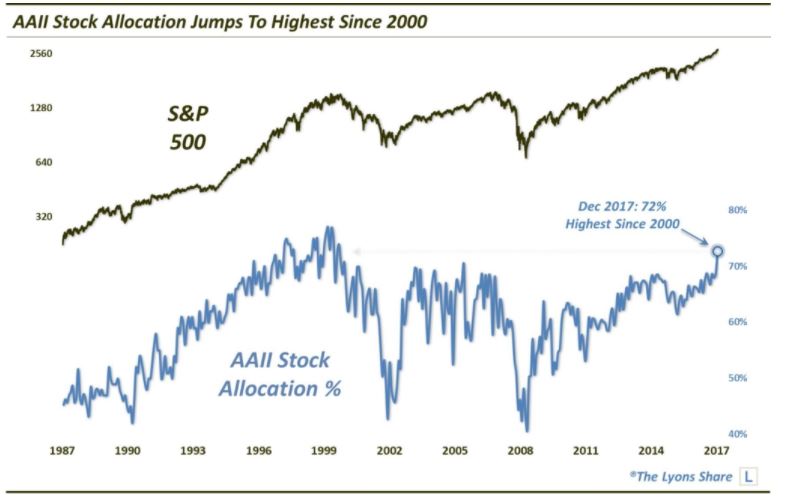
Yes, so long as more indiscriminate cash continues to flood into these markets than is trying to cash out, prices could levitate a while longer.  But at some point cash and margin room do run out.  Today margin debt is already far past the 2000 high (see the chart here) and monthly asset-allocation reports show that institutional and individual investor portfolios are already holding record lows in cash and 72% in stocks (the all-time peak in 2000 was 77%) as shown below.  Everyone that is willing to bet on miracles, or who is paid to gather assets or sell financial products–rather than manage risk–is already all-in.

If confidence and ‘fear of missing’ out prevents today’s holders from cashing out stock market bets at all-time cycle highs, the truth is that most never will –until they are forced by crashing prices, terror, margin calls, ETF sales and mutual fund redemptions as the masses liquidate and flee once more ahead.

So if you, your broker or manager are holding your savings in risk-assets today, you should understand the extreme odds against this bet, and ask yourself this question:  what percentage of your life savings can you afford to lose 50-80% of and then wait years trying to recover?

That answer will help you decide how much to bet on a ‘GOAT’ today.


Posted in Main Page | Comments Off on How much life savings should we bet on a ‘GOAT’?

Opportunity coming for those who are ready

While still up .7% over the last year, Toronto home prices fell for the 7th consecutive month in December, down 8.9% since May–the largest seven-month decline in data tracked since 2000. Falling 3.5% since November, the average sale price in Toronto is still–a wildly un-afforable for most–$735,021 ($1.2 million for single detached homes.)  See Toronto home prices fall for seventh month as lending tightens. Here is the chart.


Still with Canadian households at record indebtedness, and new lending restrictions just biting this month, the long overdue slowdown in the real estate sector is barely just started in Canada.  The economy which has been precariously dependent on this one sector since at least 2014, wobbles in the balance. See:  Global Housing Markets are ‘slowing sharply’. Is Canada next?

As the Bank of Canada frets over consumer debt levels and fantasizes about room for higher rates, this month’s new “stress test” for traditional mortgages is expected to reduce homebuyers’ purchasing power by about 21% (ie., 21% lower prices needed) and disqualify 1 in 10 would-be-borrowers in 2018 and beyond.

Now more levered than Americans before their housing bubble bust in 2006, Canadians are wholly unprepared for a secular downturn in real estate–something not seen in Canada since 1989.

After the average house price in the greater Toronto area (GTA) increased 113% in real terms between 1985 and 1989, the bubble burst.  See Toronto housing bubble in 1989:

Coupled with the early 90s recession, a spike in unemployment and a drop in the inflow of immigrants to the area, housing prices in the GTA collapsed. Between 1989 and 1996 average price of a house in GTA have declined by 40% adjusted for inflation…Downtown of Toronto was hit the worst with over 50% decline in value of a home.

Most often missed in these discussions, is that once debt and speculation-fueled financial bubbles burst, it typically takes more than a decade (or two!) for prices to recover their prior peak. By then those who held high, with leverage and low cash liquidity, have long since liquidated low with losses:

Unaccounted for inflation, it took 13 years for the average house price to recover in the GTA. In nominal terms, the average price breached the 1989 peak of $273,698 in 2002.

Only those who are prepared and waiting with low-leverage, patience and cash savings are able to take advantage of the most lucrative and low-risk investment opportunities in each secular cycle; while the unprepared–oblivious and/or reckless–as well as those needing to downsize holdings to raise cash for retirement, all suffer in the aftermath.

This price expansion cycle has been extra-long thanks to financially suicidal, central bank-enabled, credit expansion following the 2008 financial bust.  This suggests that the price contraction cycle–investment opportunity–that follows next, while also be equal and opposite in the other direction.  Who is ready?

Posted in Main Page | Comments Off on Opportunity coming for those who are ready

Getting young people off on stable start is essential for all of us

I was speaking to an art dealer yesterday who was explaining that art galleries are closing all across North America:  “Only wealthy investors are buying art at auction these days, galleries can’t make a go of it.  Young people are all about the internet, they have no interest in art,” she said.

“They can’t afford it”, I replied.

In the conversation that followed, I explained how the credit bubble had enabled boomers to buy multiple large homes and fill them with a record number of things, including art.  But now their walls are full and they want to downsize–not increase their ‘stuff’– and they have a problem:  a shortage of able buyers.

Young people are struggling with massive student debt, zero savings and poor job opportunity, most are struggling to pay rent, never mind buy art. This is a problem for them; but it’s also a problem for all of us who are hoping to downsize present holdings and overhead (real estate, vehicles, securities, collectibles, insurance, maintenance…you name it) and raise cash.  Who will buy?

Until we get younger people out of debt and earning a life-supporting income, this issue will continue to hold back the economy, close traditional businesses and reduce prices for every asset type.  We are all in this together, whether we realize it or not.  See this excellent article for more detail:  Generation screwed: millennials’ scary financial future.

I also highly recommend Muhammad Yunus’s latest book “A World of Three Zeros:  The new economics of zero poverty, zero unemployment and zero net carbon emissions” for some fresh thinking on how to get young people, and our weak economy, up and out of current quagmires.

Posted in Main Page | Comments Off on Getting young people off on stable start is essential for all of us