Canadian realty prices face secular headwinds

Realty prices in Ontario, dropped sharply in September.  In the Greater Toronto Area (GTA) 1 hour north of the city (where I live), average prices have already come off about 20%+ from last spring.  And while the stricter mortgage rules announced for January will doubtless prompt some to try and squeeze into properties before Christmas, market weakness in 2018 is likely to continue.  See New mortgage rules expected to heat up Toronto housing before winter chill:

While the industry hoped for, and failed to see, a surge of back-to-school homebuyers, the further tightening of mortgage rules could add some temporary autumn heat. BNN’s Greg Bonnell looks at what the experts are saying about one of Canada’s hottest housing markets. Here is a direct video link.

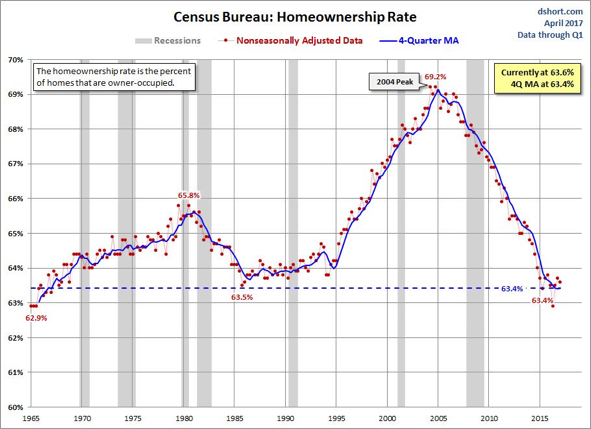
After peaking at 69.2% on subprime mortgage madness into 2005, the US homeownership rate spent 12 years round-tripping back to its 50-year average around 63% as shown here.
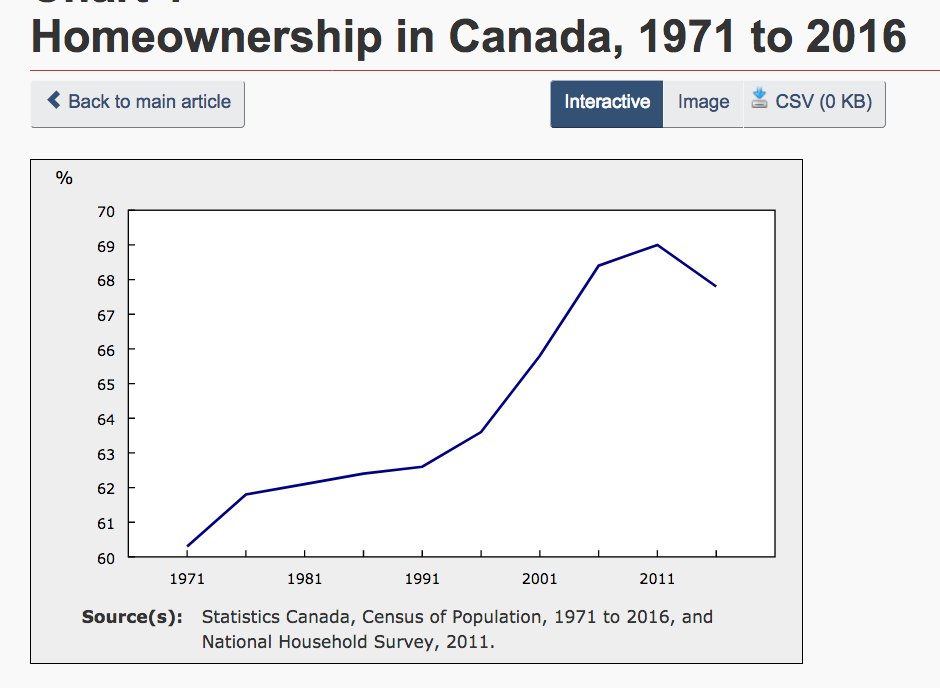
In comparison, after 20 years of steady increases, the Canadian Homeownership rate from the most recent 2016 census was 67.8% —down from the 69% peak in 2011.  Since both US and Canadian rates of ownership were driven higher by baby boomers and ever easier credit availability, it is likely that Canada’s rate, like the US, will also mean revert over the next several years, as boomers look to downsize and credit availability and appetite contract.
Posted in Main Page | Comments Off on Canadian realty prices face secular headwinds

The real math of equity allocations

Secular bears are born from extended periods of indiscriminate buying and speculation that drive prices paid for securities to irrational multiples of real world items like revenues, cyclically adjusted earnings, tangible assets and wages. And then they mean revert.

Bulls say buying and holding at any price is smart investing, because ‘over the long-run’ market cycles spend more time and points going up than down. This misses the math of the matter utterly.

It is not the duration of the upcycle that is definitive of net returns, but rather exposure to the intermittent loss cycles.

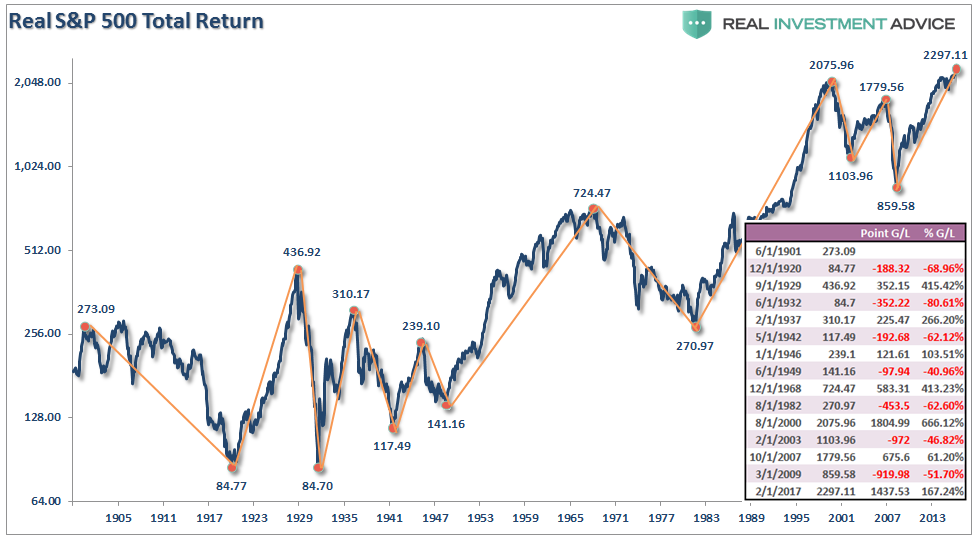
The inset table on the far right of the below chart from Lance Roberts shows the bull and bear periods for the S&P 500 since 1900–both in terms of index points and the percentage gained and lost each time.   As shown in the chart itself, the shorter recurring bear cycles take back most and sometimes all of the real gains clocked during the longer bull upcycle.

In addition, and most importantly, since bull markets increase confidence and risk-taking as they go, capital tends to get pushed in most near tops and least near bottoms, making the cyclical mean reversion periods much more capital destructive than even this chart would suggest.

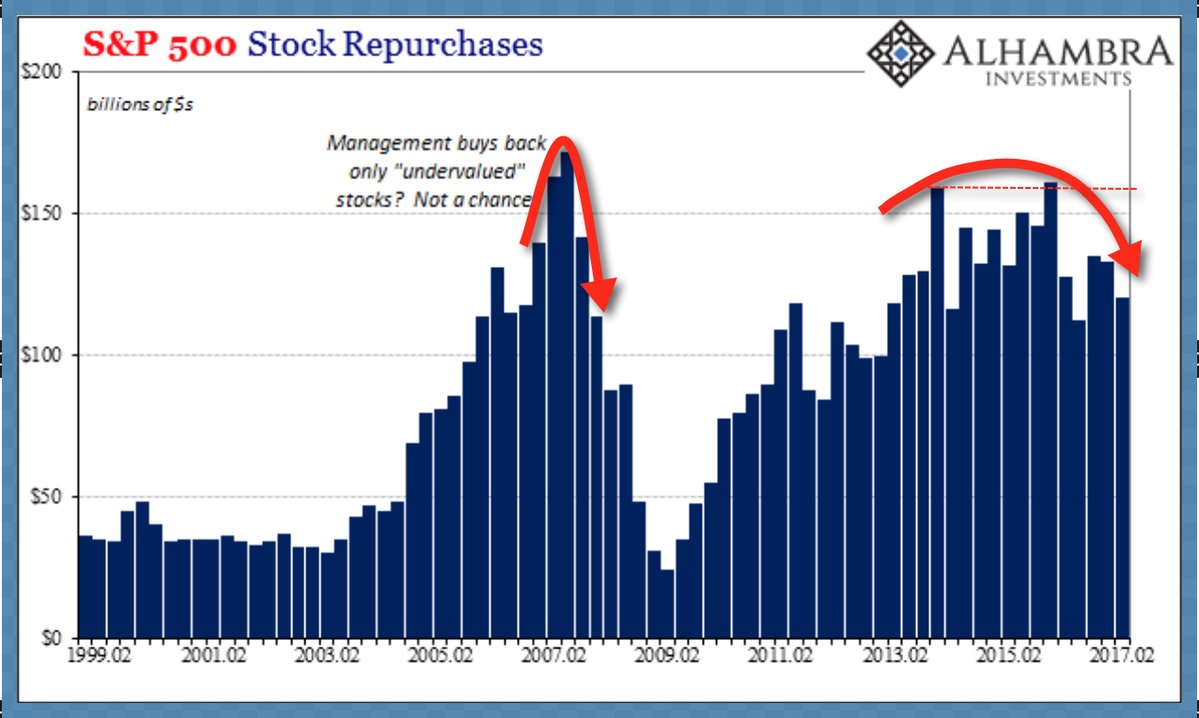
The same goes for corporate management teams and their so called “active” shareholders, that infamously waste good money buying back badly over-valued stocks each market peak, as shown here since 1999.

As people amass more and more of their life savings, and have less and less time to grow back losses, the extent to which they are protected from the downcycles becomes the most defining element of real life investment outcomes. This is especially the case during secular bear periods, where the recurring cyclical declines tend to be twice as deep and long as during periods starting from low valuations (ie., secular bulls like 1982-2000).

Yes, the current upcycle is one of the 3rd longest in market history in terms of years, but a decline of 50% from here would still wipe out all the apparent capital gains since about 1996.  And given the extremity of present valuations, holders will be lucky if they ‘just lose half’ this time.

The long-always crowd can mock risk-conscious managers all they like, but mean-reversion and the math of loss rule secular bears, and hubristic hares and those following their advice, don’t win over full market cycles.

“Reality is that which, when you stop believing in it, doesn’t go away.” ― Philip K. Dick, author

Posted in Main Page | Comments Off on The real math of equity allocations

The way humans get electricity is changing forever

The experience curve is driving evolution.

Here is a direct video link.

Also see  The World’s tiniest power market will leverage big data to sell solar:

In mid-December, National Grid Plc will flip the switch on an automated trading system that pays hospitals and research facilities at the Buffalo Niagara Medical Campus to sell electricity from their onsite solar panels, batteries or other generators to doctors’ offices and businesses — the first power market ever designed within a single utility service area.

The micro-market is an example of the Uber-effect, applying big data to better monetize small assets. The same technology could be used to help homeowners sell electricity from rooftop solar panels to their neighbors, and it may be a key part of New York Governor Andrew Cuomo’s plan to get half the state’s power from renewable sources by 2030.

Posted in Main Page | Comments Off on The way humans get electricity is changing forever