
When this ridiculous stock market implodes once more, strategists will be scampering to explain how some unexpected event caused losses that “no one could predict.” That of course will be just as false then as it was in 2000 and 2008. The below chart offers a reality check for anyone wishing to stay awake and ahead of the curve.
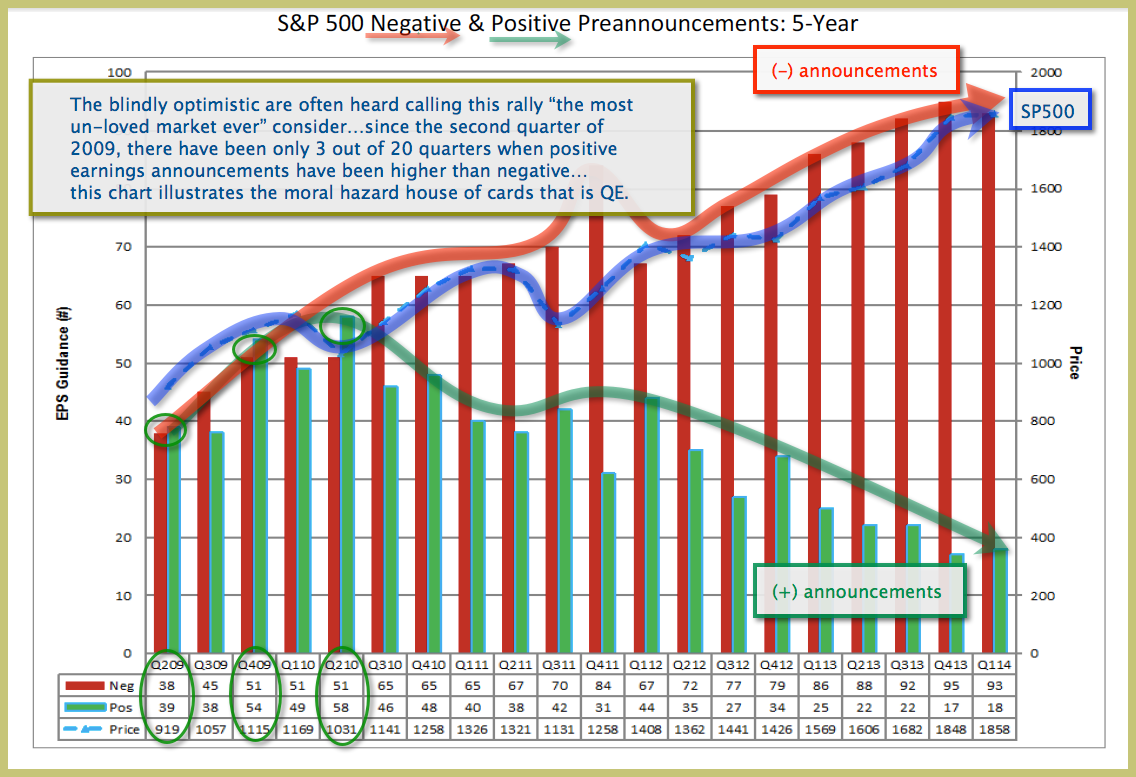
Data source see: Factset
Follow






_________________________
Cory’s Chart Corner

Odd that a story like this should appear only in foreign media.
I've been waiting for Canadian MSM to explore how CF veterans feel about the contempt in which they are held by the Trump admin. Good to see someone's done the work.
‘Spit on our sacrifice’: Canadian veterans fume after Trump and allies take jibes at military
Military families say Trump officials ‘owe us an apology’ after disparaging remarks by JD Vance, Pete Hegseth and others
www.theguardian.com


