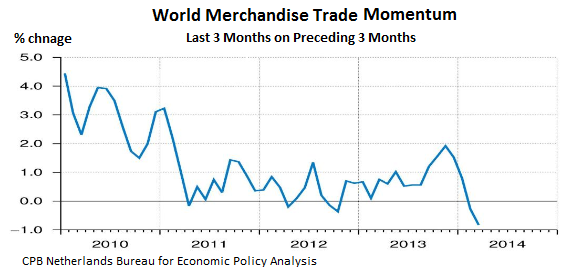
As I have mentioned a few times of late, world trade turned negative in Q1 2014 for the first negative quarter sine the recession of 2008. Thanks to a regular reader in the Netherlands for bringing the following big picture chart to my attention this morning.
While stock bears have pretty much all gone into hibernation in 2014 and bulls have recently been the most confident since the fall of 2007, underneath the surface, some remarkable trend reversals have been underway. Those holding previously hot tech and small cap sectors are not talking much about their losses the past few months, and those who aren’t holding them are largely unaware. But here is a little summary:
“LinkedIn skidded 40.6% from its 52-week high, Twitter 57.5% in five months. It’s not just a few fallen angels. The Russell 2000, which tracks the 2000 smallest stocks in the Russell 3000, is down 9.1% from its 52-week high. The FDN Internet Index 16.1% in three months, the NBI Nasdaq Biotech index 16.5%, the Social Media Index SOCL 24.4%. Stock after stock has taken a brutal licking, papered over by the Dow and the S&P 500 whose components, the largest companies in the US, have largely held up so far. But beneath them, the Fed’s illusory “wealth effect” has begun to reverse. See: This happened twice before
Things like “unexpected” reversals in global trade/growth and rapid implosions in momentum stocks and sectors are all par for every market cycle course. But since so few people accept or prepare for this fact, it routinely takes heavily indebted and over-leveraged participants by abrupt ‘surprise’. This triggers cash flow shortfalls and margin calls that force selling to raise cash as prices fall. As shown in the remarkable margin abuse chart below, as high beta stocks have plunged since March, margin has finally begun to decline from all time record highs. The last two times this pattern topped and rolled over in March 2000 and July 2007, the selling culminated in 50% declines in broad market prices over the following 24 and 20 months.
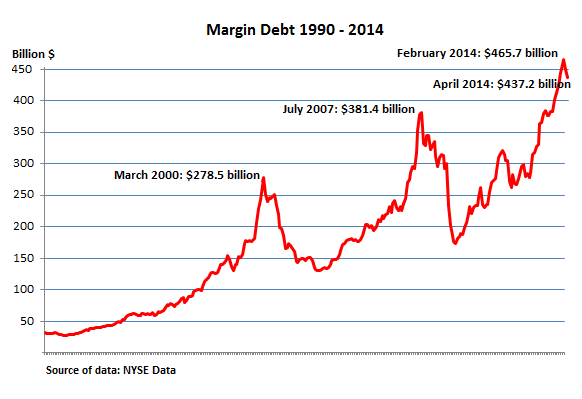
‘Margin debt – newly created money that is plowed into stocks – is the great accelerator on the way up. It inflates values and increases leverage, and when it spikes, it performs miracles. But it has a terrifying habit: after going into a majestic spike, it reverses abruptly right around the time stocks crash.
Over the last 15 years, margin debt had three spikes and reversals:
The first spike peaked in March 2000 at a record of $278.5 billion, or 2.66% of GDP. By the time it reversed in April, the stale air was hissing out of stocks with epic speed.
The second spike peaked in July 2007 at $381.4 billion, or 2.60% of GDP. In November, stocks began to swoon. No one will ever forget what happened next.
The third spike – the most phenomenal yet – peaked in February 2014 at $465.7 billion, beating the prior record by 22%. It reached 2.73% of GDP, the highest ratio ever! In March, the spike reversed. And in April, it declined again.’