
The Willshire 5000 is considered the definitive US stock index reflecting the market cap of most publicly traded companies headquartered in America (3,691 as at 2015). As such, it includes the majority of common shares and REITS traded through the New York Stock Exchange, NASDAQ and AMEX. And as shown here since June 2014, the Willshire has been tracing out a pretty classic-looking topping pattern since late 2014.

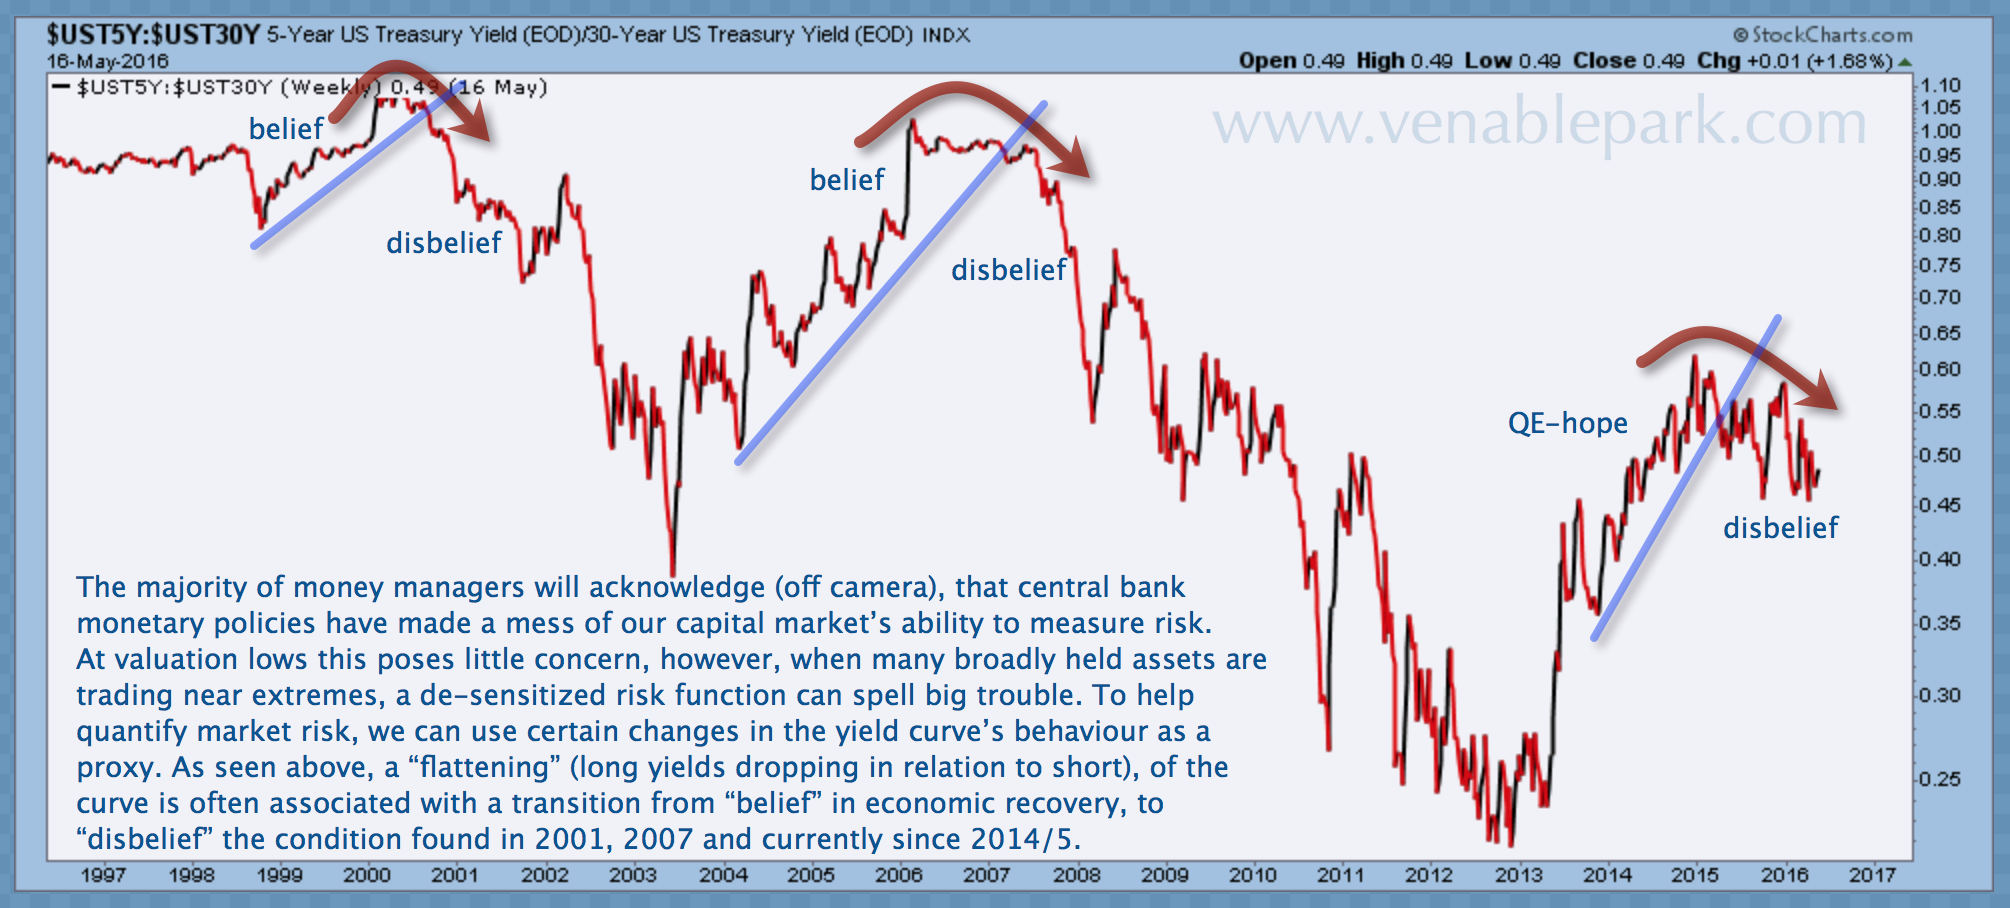
At the same time, US bond yields seem to agree with the Willshire’s woozy outlook. As shown below, the spread between 5 and 30 year US Treasuries has been flattening since 2014 as well. We noted a similar pattern and growth-non-confidence-vote from the treasury market leading into the recessions and stock bear markets of 2001 and 2007. Noteworthy formations.
Follow
_________________________
Cory’s Chart Corner
This goes with my most recent post...stunning acknowledgement by A.I execs of labour theft (taxpayer wages). h/t @MotherJones
Mother Jones @MotherJonesJaw-dropping documents from our lawsuit against Microsoft and OpenAI reveal how tech leaders talk when they think no one is listening: We may have pulled off “the largest theft of labor in human history” https://www.motherjones.com/politics/2026/09/openai-chatgpt-microsoft-copyright-legal-case-documents-revelations/
_________________________
Danielle’s Book
Media Reviews
“An explosive critique about the investment industry: provocative and well worth reading.”
Financial Post“Juggling Dynamite, #1 pick for best new books about money and markets.”
Money Sense“Park manages to not only explain finances well for the average person, she also manages to entertain and educate while cutting through the clutter of information she knows every investor faces.”
Toronto SunSubscribe
This Month
Archives
Log In






