The US dollar is continuing strength this week. While the dollar index (basket of major trading partners euro, yen, sterling, CAD, krona, franc) is up just over 3% year to date, its gains against emerging market currencies have been multiples more. Because periods of free-flowing dollars (via international trade, easy credit and low rates) tend to weaken the greenback and encourage U$ indebtedness in emerging economies, cycles of dollar appreciation then tend to wallop the heavily-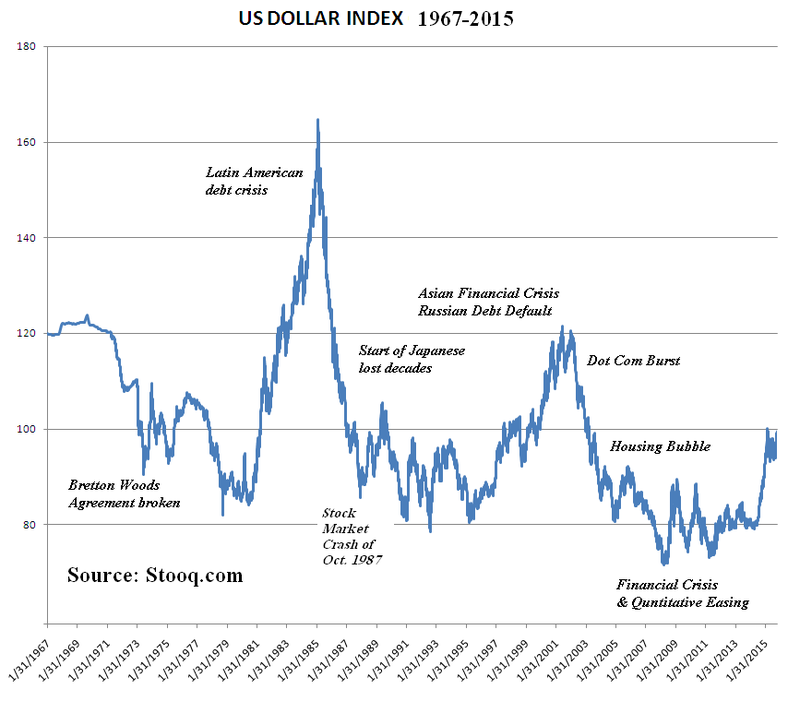 indebted with leaping carrying costs and incidents of financial crisis. As international liquidity and solvency problems surge, safety-seeking capital flows into the dollar and treasuries typically intensify. This chart on left of the dollar index shows the pattern between 1967 and 2015.
Year to date, greenback, is up more than 5% against the Canadian loonie (its largest export market), making US goods more expensive for Canadians.
This chart from my partner Cory Venable offers a big picture view on the US/Canadian dollar exchange rate since the 1970’s.

Here we can see on a weekly view (upper left inset) that the US dollar has broken through the near term resistance which has dominated since January 2016. If it closes the month at or above current levels it will suggest higher highs with a potential re-test of the 2002 cycle top around 1.60 (red box).
In the process however, the strong dollar and its deflationary affects in the US, along with ongoing havoc in global trade and emerging economies will prompt the US Fed to stall in their rate hiking plans. The weak dollar pendulum began swinging back in 2011, those who missed this turn and banked on continued weakness are likely to be heavily hit in the months ahead. It is important to note that the last few recessions were triggered by financial market strife, not the other way around.