Because real estate is the most widely held asset in the world, its cyclical moves tend to be the most economically impactful. After a fifteen-year upcycle, Canada’s two most populous metropolitan areas–Toronto and Vancouver–entered 2017-2018 with the dubious distinction of having some of the most over-valued real estate in the world. But real estate has always been a cycle.
Once a major expansion ends, it is usual to see a surge of bankruptcies and debt defaults amid a decade+ of flat to negative price trends, euphemistically known as a ‘consolidation’ period. During this phase, those who should not have bought when prices were high, or need to raise liquidity, end up losing or selling properties to those who can buy at lower prices where affordability and investment ratios become attractive once more.
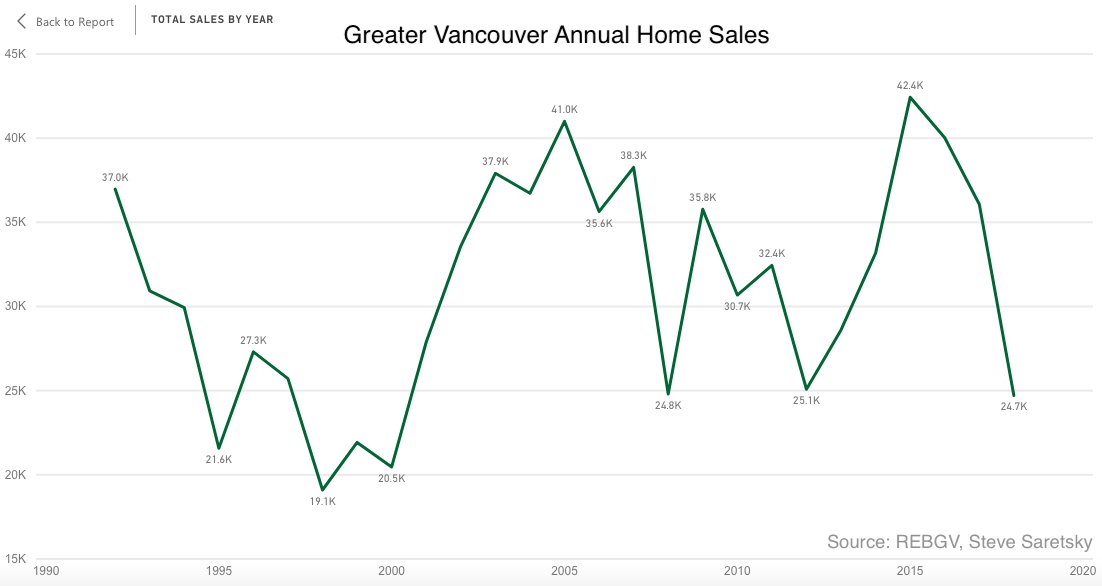
While the realty market uptrend in Canada from 2001 to 2016 ran about five years longer than historically typical–courtesy of record low-interest rates, lax lending and speculative buying–the down cycle is finally underway. Historical patterns show that sales trends lead price, and Vancouver typically leads Toronto by about nine months.
As shown here, Vancouver home sales volumes peaked in 2015-16 and fell to the lowest level in 18 years in 2018.
 See Sales to decline in 2019:
In Vancouver, detached sales peaked in June of 2016, one month before the end of the 30% price surge and continued to fall year over year for 13 months. Sales totals then rebounded for six months before crashing throughout the rest of 2018. Toronto has followed the first two steps of this path to date perfectly. Sales peaked in March 2017, two months before the price peak before falling for just over a year. In June 2018, sales picked up for five months before once again trailing year over year by November. This leaves Toronto to match the severe drop in sales Vancouver is currently experiencing to repeat all three steps.
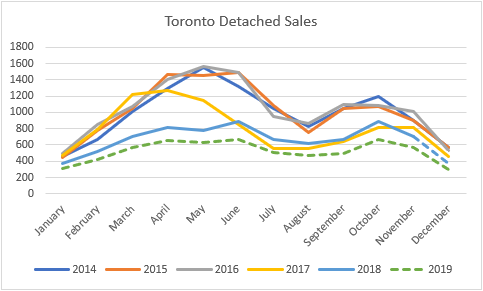
Toronto home sales have also weakened since 2016, but as shown below from TREB and Six Housing Sense, in 2018 detached sales were just back to levels seen last in 2014. Further weakness is projected for 2019 (green dots) in the Toronto and Vancouver metropolitan areas–both of which are economically-important consumer spending capitals.
 What this means for individual realty prices is hard to pinpoint, as supply constraints can make some areas more resilient than others. However, an abundance of properties in the unaffordable-for-most million dollar plus category, that are owned largely by the over-age-50 demographic, is likely to make them extra-susceptible to downward pressure as present excesses unwind and boomers look to raise cash, reduce maintenance and expenses.
Further, owners of expensive properties today are the same socio-economic group who make up the majority of the retail stock, ETF and mutual fund owners who, by mid-2018, were the most risk-exposed to corporate securities since the 2000 market peak, and so are now seeing their savings plummet once more.
More than any other time in the last 50 years, the net worth of present asset owners is being hit by cyclical downturns in both real estate and corporate security prices all at once, and for many, it is coming at the worst possible time.
On the other hand, those who have been building up cash and waiting to buy are likely to reap reward as this process unfolds. Not jumping too early will be the trick.